Statistical Facts of Artificial Stock Market
The price emerged by the agent’s interactions is calculated by the excess demand in
each round, i.e.:
⎟
⎠
⎞ ⎜
⎝
⎛ ∆ = + − = ∑
N
i
i
t p p t p t x
1 ( ) ( 1) ( ) λ …(5)
where λ is the market depth or liquidity, the excess demand needed to move the price
by one unit. The market depth measures the sensitivity of price to fluctuations in excess
demand (Cont & Bouchaud, 2000).
As a summary of the model overview, we can see table 1 showing the value of
variables used in simulations.
Table 1
Initial Simulation Configuration
Parameters Value
Number of iteration 10,000
Number of agent (investor) 200
Formation fundamentalist-chartist-noisy 42-109-49
Chartist (h=30) – (h=60) – (h=100) 46-33-30
Stock owned by each agent 10
Money owned by each agent IDR 20,000
Market Depth (1/ λ ) 10
Basic price each stock IDR 5,000
- Simulation Results
We do several simulations in our artificial stock market in order to have some
understanding points of what we discover in previous work on statistical properties of
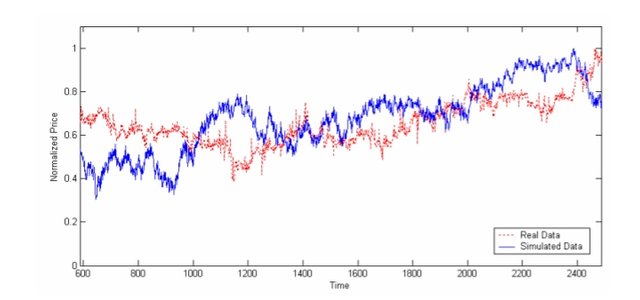
Figure 1
The simulation result compared to the real normalized hourly price data of a dominant indivi