New twist on classical novae
We've all heard of a supernova, but what about classical novae? These close astronomical cousins are similar in many ways. They both involve a close binary system with a white dwarf and a main sequence star. The gravity of the white dwarf sucks hydrogen away from the sun-like star onto its accretion disk where it makes its way to the surface of the white dwarf (see Figure 1). After a critical amount of hydrogen is reached, a thermonuclear reaction is triggered. Here is the difference: In a Type Ia supernova the reaction takes place throughout the entire white dwarf which completely destroys the progenitor. However, in a classical nova the reaction only takes place on the surface so the binary system remains intact.

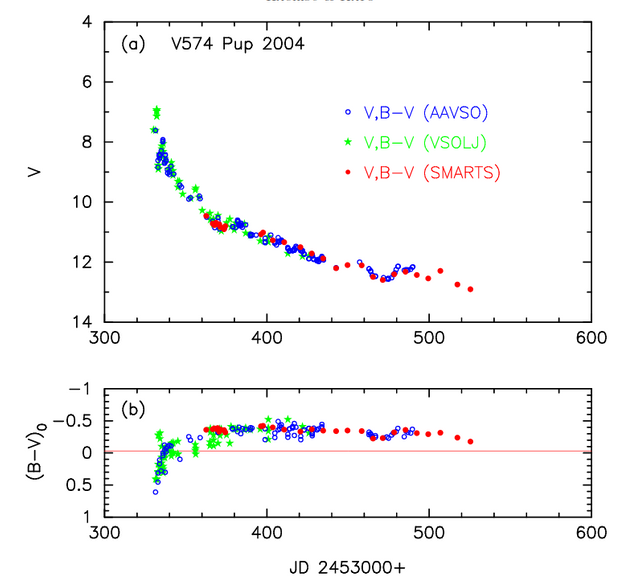
Classical novae are also important because information can be gleaned from their light curves. As you can see in Figure 2 below, the magnitude quickly skyrockets (remember, lower magnitudes imply more brightness) during the classical novae's thermonuclear event and then gradually fades back down. The decline rate is a good indicator of the white dwarf's mass (Hachisu & Kato 2019). Furthermore, the difference between observed and absolute magnitudes can be used to estimate the distance to the system.

Usually, these magnitude measurements are made using the "V" filter, which corresponds roughly to the visual part of the electromagnetic spectrum. However, sometimes astronomers will combine measurements from two filters to get a better idea of the object's color. For example "B-V" represents the difference of measurements between the blue and visual filters. Hachisu and Kato used this information to essentially apply a color correction to the data that improves the distance estimate in better agreement with Gaia measurements. This technique could help further refine other distance measurements made using classical novae.

References
Hachisu, I. H. and Kato, M., 2019, https://arxiv.org/pdf/1902.10919.pdf
Congratulations @ptsouth97! You have completed the following achievement on the Steem blockchain and have been rewarded with new badge(s) :
Click here to view your Board
If you no longer want to receive notifications, reply to this comment with the word
STOPDo not miss the last post from @steemitboard: