Data analysis on corona spread in China: 1/22-2/08
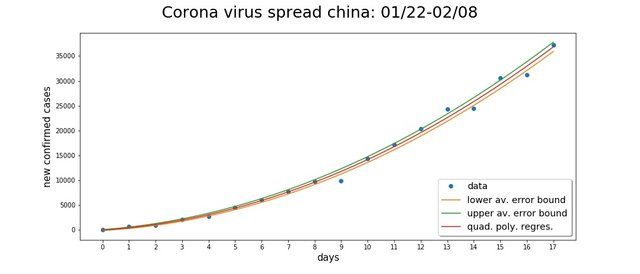
I found data on new confirmed cases of the corona virus. Data on china seems to be sufficiently big to do some basic data analysis. Predicting the evolution of the virus spread using regression seems meaningful. Here is the main result I got with a little bit of python:

The red line is a quadratic polynomial that has been fitted to the data using regression. It is quite surprising that a quadratic function can be fitted so well to the data. We are at the part of the quadratic function where it keeps increasing so hopefully it will behave more like a cubic function in the future. The bounds, the orange and green lines, are predictors for how much the data will most likely be off from the red line. There is a neat technical method for how I came up with this, see the technical section below.
If you want to use the graph or want the script let me know :o)
Technical section
Given the quadratic function obtained through regression you can compute the (absolute) error. It appears that after ordering the error behaves like a linear function. Therefore, the average error is a good predictor for error bounds. You can pull the error study to the domain of the quadratic function since on the domain corresponding to the range we are interested in the quadratic function is strictly increasing.
Data on Github: https://github.com/CryptoKass/ncov-data
Merchandise :D
I haven't promoted this in ages but let's give it a try again. There is a MathOwl shop which sells my artsy fartsy stuff. If you got some spare monies head over there. Many thanks to suesa and terrylovejoy for being my customers. Those peeps are hootiful.
Well, just spent 20 minutes looking up how a cubic function graph might look :))
Didn't buy anything, but shared your Rebdubble link on Twitter.
It is a more powerful quadratic function :P
Posted using Partiko Android
Makes me wonder why should it be a quadratic or cubic function? Assuming the virus has just began to spread and there are still no countermeasures in place should it not be like some exponential function xn, where x is average number of people infected by each patient and n is nth round of spread (which would depend on time taken by patient to come in contact with x new targets). I think I should read more on disease modeling. This fit seems interesting, nonetheless. Makes me wonder what are dynamics of the spread.
If you where in a big hall with the middle person infected, nobody moving and assume that the person who is uninfected will get the disease with 100 percent certainty if they stand next to an infected person, then the new infections will behave linear since the circumference of the circle increases linear with the radius. So exponential behavior is probably based on some kind of additional assumption.
Posted using Partiko Android
Hi @mathowl!
Your post was upvoted by @steem-ua, new Steem dApp, using UserAuthority for algorithmic post curation!
Your UA account score is currently 3.867 which ranks you at #4805 across all Steem accounts.
Your rank has improved 4 places in the last three days (old rank 4809).
In our last Algorithmic Curation Round, consisting of 93 contributions, your post is ranked at #41.
Evaluation of your UA score:
Feel free to join our @steem-ua Discord server
This post has been voted on by the SteemSTEM curation team and voting trail. It is elligible for support from @curie and @minnowbooster.
If you appreciate the work we are doing, then consider supporting our witness @stem.witness. Additional witness support to the curie witness would be appreciated as well.
For additional information please join us on the SteemSTEM discord and to get to know the rest of the community!
Please consider using the steemstem.io app and/or including @steemstem in the list of beneficiaries of this post. This could yield a stronger support from SteemSTEM.