The Physics of Color
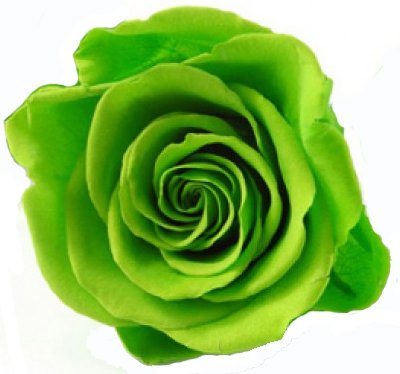
We know many names of colors, but actually How many do we know?? 12/24/36/100??? But actually, there are more than thousands of colors. Suppose, what is the color of this flower?? Green?? Light green?? Shamrock or Fern?? Ask this question to several persons and make a note and surely all the answers are not going to be same. The perception and the interpretation of color depends on several factors such as eye fatigue, age, the surroundings, viewing angle, the angle at which light is interacting with the matter and other several factors and this makes difficult to make color communication and without using a standard it is hard to check the color with accuracy. To get rid of this problem, a color measuring machine is required. Now let’s go deep.
Attributes of Color
As we know there are more than thousands of colors, those colors are different from one another and every color has its individual appearance. And this individual appearance is based on three attributes.
Those are:
• Hue
• Chroma
• Value
Hue
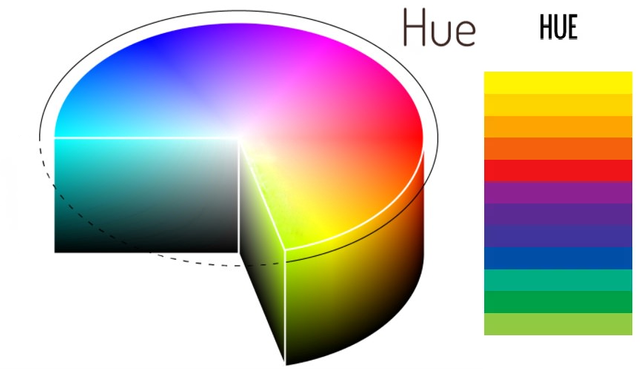 Figure: Hue
In simple, it is the perceiving of any thing’s color. It is the thought of color that we have in our mind in the first appearance. Such as: what is the color of apple?? Red. What is the color of tomato?? Red. But there is a difference between the red of apple and red of tomato. In the following figure, we can see the border is indicating the HUE. Those colors can be indicated by hue angle(using polar co-ordinates, according to CIE L*C*h*) h* = 0, red h* = 45, orange h* = 270, blue h* = 315, magenta
Chroma
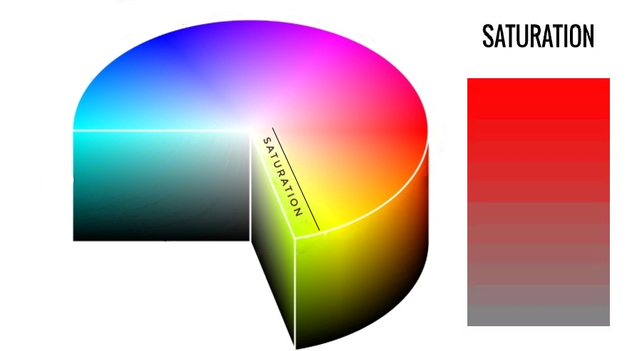 Figure:Chroma(saturation)
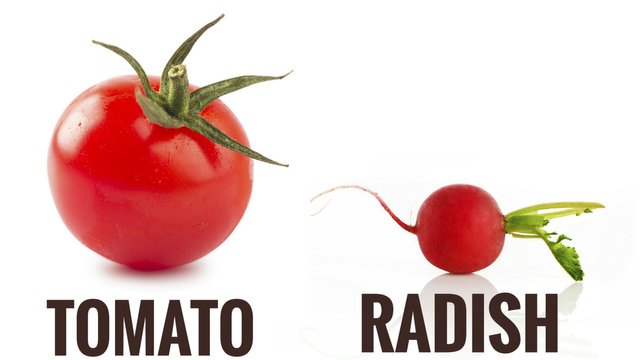
The vividness or dullness of a color is the chroma or saturation. In the other words how much the color is close to the gray or pure hue. Lets talk about the color of tomato and radish. The red of tomato is vivid and on the other hand, the color of radish is much duller. In the figure, the center of the circle is gray and the border of the circle is pure hue. This color range from gray to pure hue is the chroma or saturation. If the color is close to gray, that’s duller and if the color is close to the pure hue, its more vivid.
Value
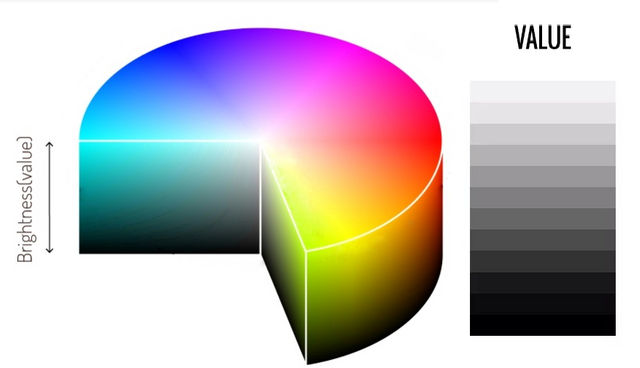 Figure:Value(Brightness)
This indicates the luminous intensity. The degree of lightness is the value of color. The color can be described as light or dark and this is done on based on Value or degree of lightness. The scale of value ranges from 0 to 100 where 0 stands for pure black and 100 stands for pure white. For example, the tomato is lighter and the radish is darker in contrast. In the following figure, the vertical axis is representing Value.
If we can number the color, that will make it very much easier for communicating easily and with accuracy. There are several ways of color numbering.
The Munsell Scale
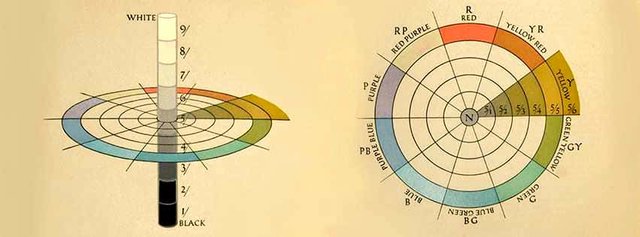
In 1905, reknowned artist Albert H. Munsell invented a color scale which we still use today.
The Munsell System of Color Notation is significant from a historical perspective as it’s based on human perception and also, it was devised before instrumentation was available for measuring and specifying color. This Munsell System allocates numerical values to the 3 properties of color, as we all know, these are hue, chroma, and value. The color samples, whose are adjacent, represent equal intervals of visual perception.
The model in Figure is the Munsell Color System and it provides physical samples for judging visual color.
As examined how any color occurs, there must be present 3 things:
• 1 light source (illuminant)
• 1 object (sample)
• 1 observer/processor
We see color because our eyes process the interaction of light hitting an object. But what will happen if we replace our eyes with an instrument?? Can it see and record the same color differences as our eyes detect?
Yes, I have seen it practically, its like a blessing for me, as i work with colors and i also got eye problem.
CIE Color Systems
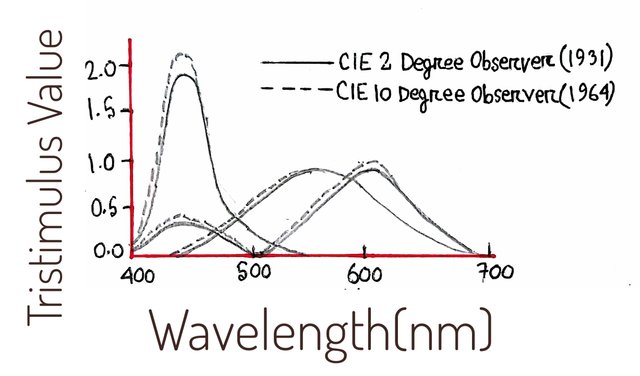
The CIE, or Commission Internationale de l’Eclairage (translated as the International Commission on Illumination), is the body, whose work is to do the proposals for photometry and colorimetry.
The commission invented a color order system which is used to derive values for describing the color, free of industry or use case.
The CIE Color Systems uses three coordinates to locate a color in a color space.
These color spaces include:
• CIE XYZ
• CIE L* a* b*
• CIE L* C* h°
To get these values, we have to understand how those values are calculated. As stated earlier to see color, our eyes need three things: one light source, one object, and one observer/processor. It is also constant for instruments to see color.
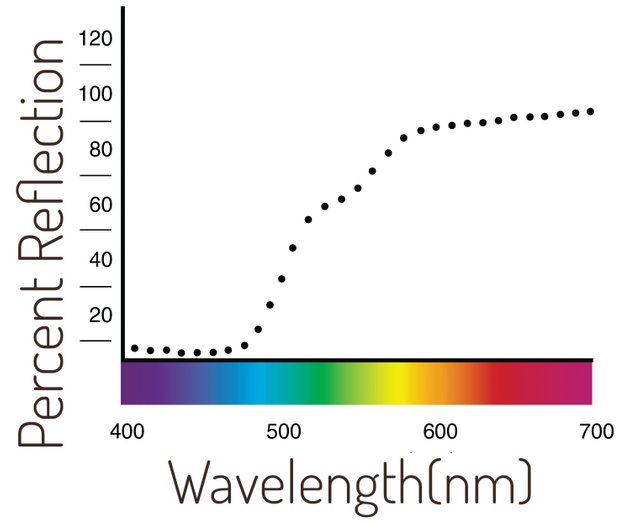
Those instruments perceive color the same way, as our eyes do. At first gathers and then filters the wavelengths of light reflected from one object. Reflected light wavelengths are perceived by the instrument in the form of numeric values from an object and after that, the values are recorded as points across the visible spectrum.
These are called spectral data whose are represented as a spectral curve and this curve is the color’s fingerprint (Figure A ).
After obtaining colors spectral, or reflectance curve, we can apply mathematics to map the color onto a color space.
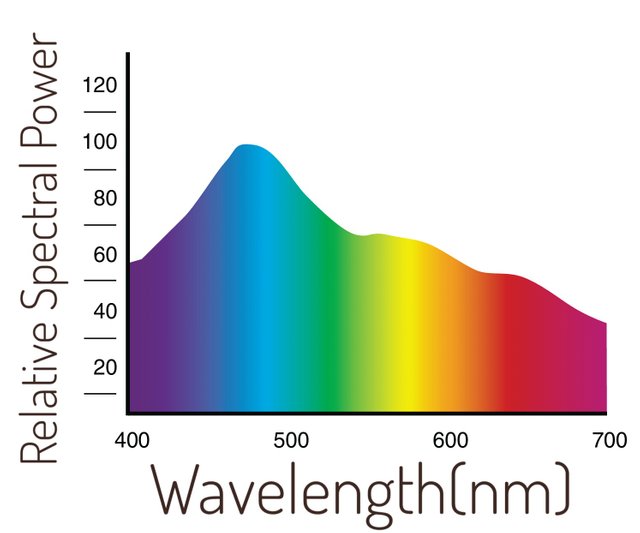
To obtain the result, the reflectance curve data have to be multiplied by a CIE standard illuminant where this illuminant is the graphical representation of the light source under which all the samples are viewed and each of those light sources contains a power distribution which affects the way we see color.
Examples of different illuminants are
• A — incandescent,
• D65 — daylight (Figure B) and
• F2 — fluorescent.
We have to multiply the result which we get after calculation by the CIE standard observer.
The commission’s work states the idea of an ideal observer, particularly based on the average response of any person to wavelengths of light (Figure C) and this ideal observer represents how an average person sees color across the visible spectrum.
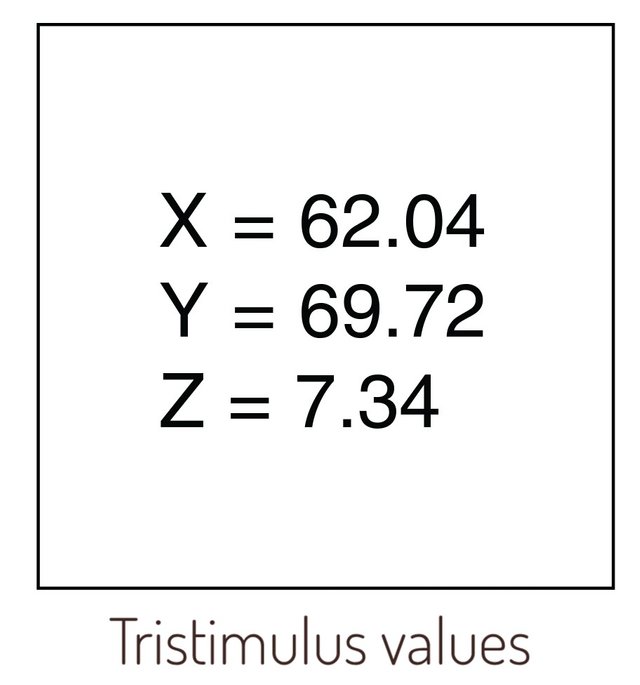
After calculating these values, we convert the data into the tristimulus values of XYZ (Figure D) and these values can now identify a color numerically.
Chromaticity Values
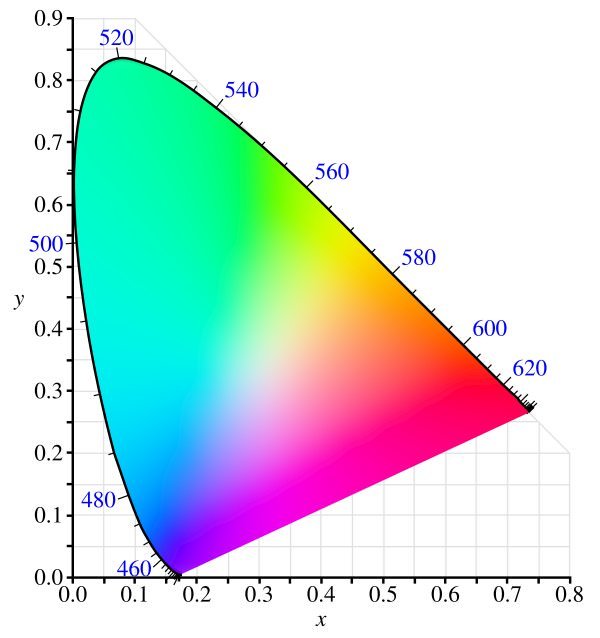
These are tristimulus values and logically they are limitedly used. This is because they can’t be correlated highly with visual attributes and correlates poorly with visual attributes. Here only Y correlates to the value, but X and Z can’t. Due to this, when the standard observer was established, the commission proposed to use chromaticity coordinates xyz by which chromaticity diagram is formed (figure). Yxy highlights color by identifying value(Y) and the color is shown in the chromaticity diagram (x,y).
In the figure, all the points at the boundary are presenting the hue. The movement of the central neutral area towards the boundary presents Chroma/saturation where 100% saturation is equal to the pure hue
Post Source
- Colour Physics for Industry, Edited by Roderick McDonald, Society of Dyers and Colourists, Bradford, England
- HSL and HSV, Accessed: April 19, 2018(https://en.wikipedia.org/wiki/HSL_and_HSV)
- Modern color theory, Accessed: April 19, 2018(http://www.handprint.com/HP/WCL/color18b.html)
- The Munsell Book of Color 1929: Hue, Value & Chroma, Accessed: April 19, 2018(http://munsell.com/color-blog/munsell-book-of-color-1929-hue-value-chroma/)
- A Grammar of Color, Accessed: April 20, 2018(http://munsell.com/color-blog/a-grammar-of-color-definition-hue-value-chroma/)
- Color Properties , Accessed: April 20, 2018(http://www.workwithcolor.com/color-properties-definitions-0101.htm)
- Color Basics, Accessed: April 21, 2018(https://www.harding.edu/gclayton/color/topics/001_huevaluechroma.html)
- HUE, VALUE, SATURATION, Accessed: April 21, 2018(http://learn.leighcotnoir.com/artspeak/elements-color/hue-value-saturation/)
- CIE 1931 color space, Accessed: April 22, 2018(https://en.wikipedia.org/wiki/CIE_1931_color_space)
- Precise Color Communication, Accessed: April 22, 2018(https://www.konicaminolta.com/instruments/knowledge/color/part4/01.html)
Conclusions and Further Reading
I am conculating my article here for this one, in the next one, i will describe the way of Expressing Colors Numerically.
Thanks for reading.
Everyone stay well and keep steeming.

Congratulations @makerniloy! You received a personal award!
You can view your badges on your Steem Board and compare to others on the Steem Ranking
Do not miss the last post from @steemitboard:
Vote for @Steemitboard as a witness to get one more award and increased upvotes!