Anyone ever pay attention to gold and silver historical price charts
Not talking about what these precious metals were selling for in the year 2000, but just in the 2017. Generally, as the price of gold goes up or down, so does the price of silver. Palladium and Platinum follow their own set of rules driven by the auto industry.
What I finds strikingly odd though is in 2017, we had peak pricing spikes both PMs about 2 months apart following by a steep downward price.
Check out the silver chart.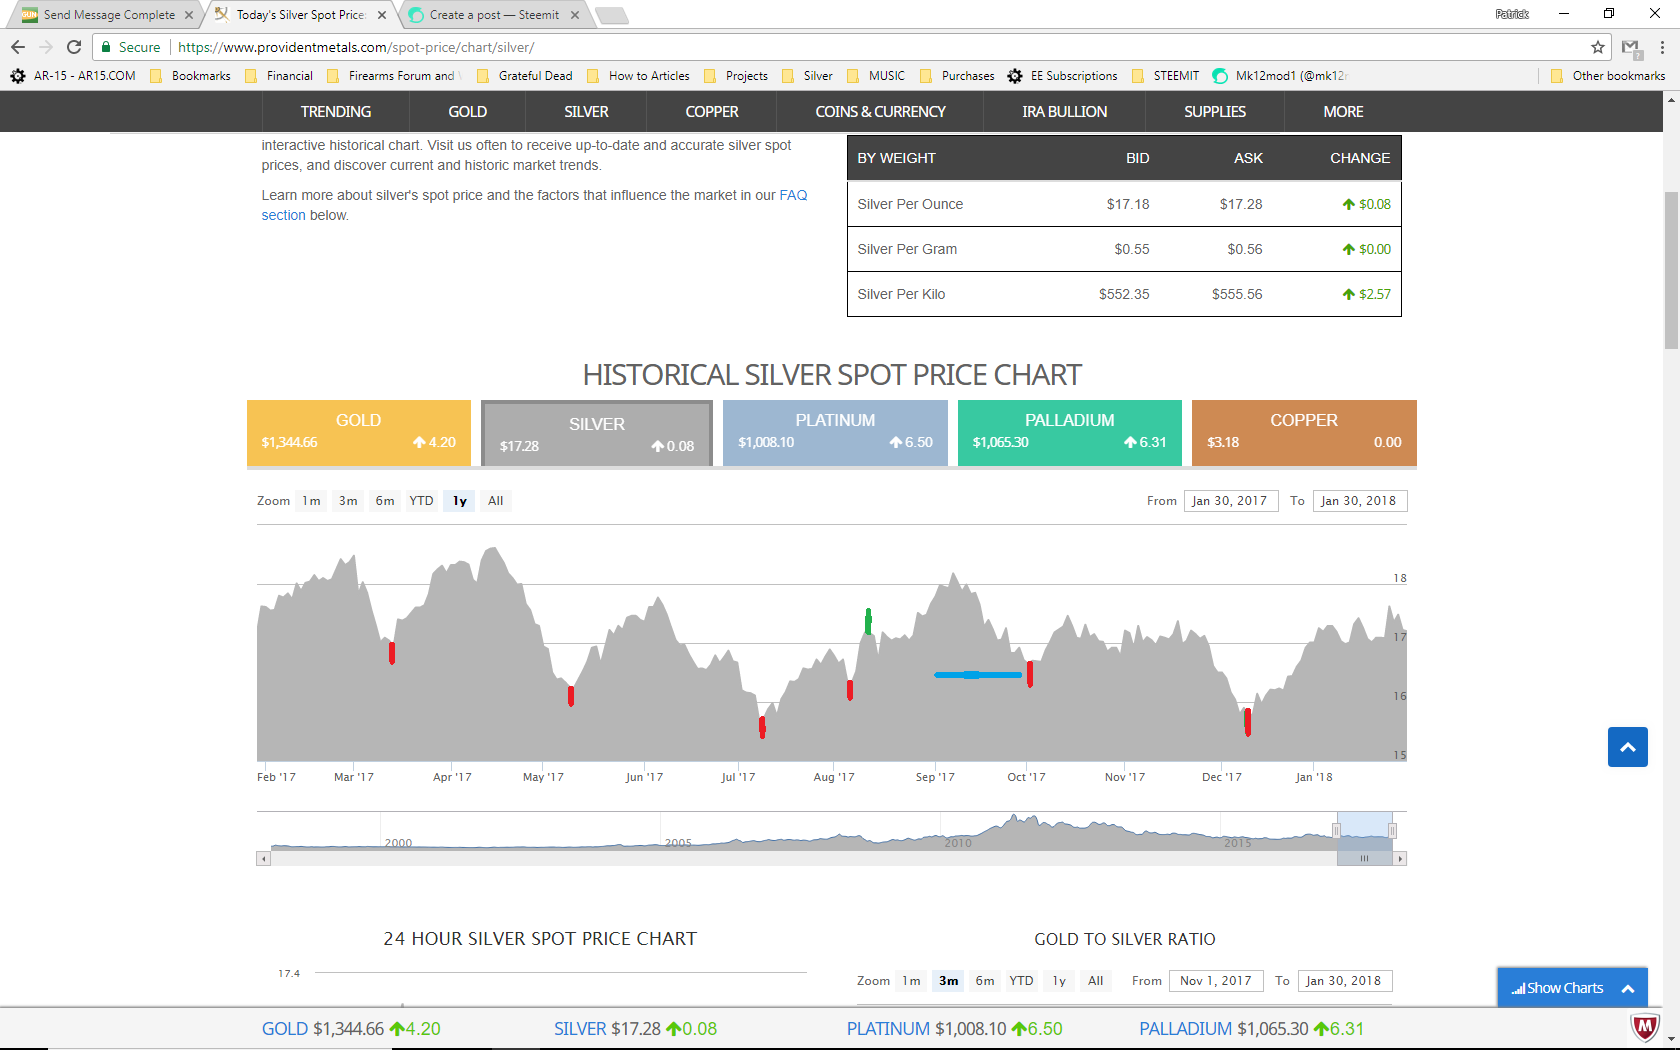
We see significant bottoming of price in beginning of March, May and July.
However in August we see a slight drop, in which I feel retarded the peak price for about a month. Furthermore, PM pricing was rather flat during most of August.
If we could magically remove the slight blip on the chart, the PM pricing would have seen a significant drop yet again in September as opposed to October.
Come the beginning of December we see another significant drop in PM pricing, which is 2 months difference again.
So by all means, by following this trend we should see a hefty price drop of PMs in February, right?
Coincidence, Collusion, Conspiracy? You tell me.......
This is an interesting review of 2017. If your predicting a hefty price drop in February, then I'm sure many in this group will be buying on the drop. Are you going to hold off on buying for the next few weeks until the drop hits?
Went back to 2015 and a very similar pattern occurred.
There were significant dips in Jan, March, May, July and than gain in Sept. Nov not only saw the dip but a stagnation of silver pricing until Feb 2016. In march and April there were some small peak and valleys, but nothing significant. Not until June of 2016 there was a decent sized dip and yet again in Aug, Oct and Dec.
Interesting?
The only condition for me to buy heavily into PMs until something Feb would be a critical occurrence in the bond/stock market.
Heavily for me is a minimum 100 oz of silver purchase which I do at least 6 times a years.
I have suspected manipulation by banks. The setting the London Fix Price is suspicious (maybe I just don't understand). The massive paper contracts on the COMEX looks like a conspiracy to me. While banks and traders gain fiat currencies based on these manipulations, the small guy looking to buy silver is at the whim of these manipulations. If it is manipulation that controls the market, then any analysis of the market is really just an analysis on the human behavior of the manipulators, which may be nothing more that a whim.
That's my two cents. I am not in the 'buy heavily' market that you are in. When I get there, I will be studying the charts, too.
This is the kind of info steemitsilve gold should be providing, not pictures of silver. Who cares about that? That does nothing to increase your knowledge and understanding of the market. There was a recent post about how JPM has accrued close to 650 physical ounces. That shit is old new as they started doing that unchecked back in 2011 after they bailed out Bear Stearns. Sorry to say steemit has all ready been corrupted as a social network as content does not matter anymore. The number of followers and auto-bot only matter.
Charts don't start a movement...charts don't get people into amassing 1oz coins or 10oz bars close to spot...and if you are buying a little every few weeks or months...who fucking cares about the charts. Joe 6-pack with 2.3 kids doesn't have time or give a shit to go look up PM Charts.
Charts haven't worked in this space for anyone other than the Large Specs frontrunning their own clients trades. Even the small commercial specs have been getting fleeced for years...so anyone on Steemit stands 0 chance of winning by looking at your charts.
But you put a lot of time into it and it is a very nice chart. Well done.
So I guess my prediction here holds no merit either?
https://steemit.com/steemsilvergold/@mk12mod1/6-arrested-for-pms-manipulation-euro-banks-pay-fines-yet-jpm-comes-up-smelling-like-roses
Furthermore, if you really comprehended my post, you would have realize I mentioned purchases of 100 oz or more (which is a lot to average buyer). So yes charts do make a difference when prices swing over a $1 or more when it come to buying power at that level.
Next time I will just keep to to myself.