SteemProjects: Weekly Report. Trader and investor community, rewarding users, light Steem client, bubble chart, a lot of updates... and more!

Hello Steemians!
This summer is really hot in Poland, but it doesn't really matter for us, because update on SteemProjects must be made! This time our content manager @lukmarcus decided to update some of the projects already present in our database - but don't worry, there are also 8 new entries!
Steem Interfaces

- Traders & Investors Mentor Market by @timm
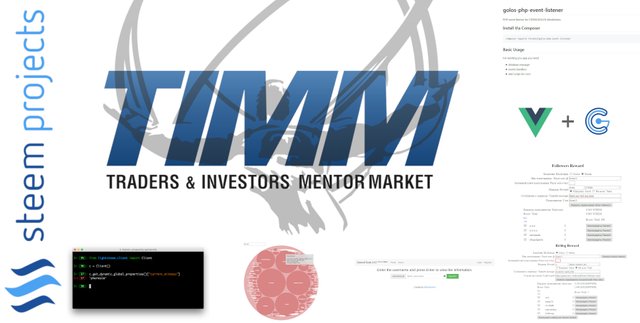
TIMM is a place where expert and novice traders and investors can collaborate in their pursuit of mutual profit. TIMM is a trader and investor community where Mentors and Members are able to interact, contract services and otherwise pursue mutual profit. Services offered include the Trading Pits (real time forum), webinars, forums, blogs, newsletters and various opportunities for communication and monetization. Other than TIMM’s basic service fees, the community embraces a free market (laissez faire) philosophy. Mentors set their own fees and all Members are able to tip and receive tips.
Data


- Lightsteem by @emrebeyler
Lightsteem is a light python 3.6+ client to interact with the STEEM blockchain. It's simple and stupid. You ask something, you get something. - Steemit Bubbles by @luschn
Show steemit followers in a d3 bubble chart (circle packing), with a circle size depending on the vesting shares. - SteemitTools.XYZ by @hunternnm (Status: Broken)
By entering your login you can find out the complete list of those who, how much and for what amount voted for you. Also the removal of non-reciprocal followers and other possibilities.
Programing tools


- Golos/Steem PHP Event Listener by @t3ran13
PHP event listener for STEEM/GOLOS blockchains. - VueSteemConnect by @mkt
This plugin provides a very simple way to integrate Steemconnect in your Vue.js project. It also provides a Vuex module to handle the user object and login/logout.
Other


- Followers Reward by @t3ran13
This simple tool will help you reward or send message to your followers on STEEM/GOLOS blockchain. - Reblog Reward by @t3ran13
This simple tool will help you reward users for resreem/reblog on STEEM or GOLOS blockchain.
Updates
- Accusta by @semasping:
Contact, images & timeline. - dlike by @certseek & @dlike:
Status & timeline. - KnackSteem by @knowledges, @luschn & @jaysermendez:
Status, images & timeline. - PHP Graphene Node Client by @t3ran13 & @semasping:
Title, website, contact & timeline. - The Magic Frog by @mkt & @helo:
Image & timeline. - Steemgg by @bobdos, @bizheng, @bonjovis, @kanny10 & @stabilowl:
Repository & timeline. - SteemitPostNotifyBot by @semasping:
Contact, images & timeline. - SwapSteem by @swapsteem
Status & timeline. - TrufflePig by @smcaterpillar:
Status, team, image & timeline.
Contact us!
We are replaying to comments so if you have any questions - ask them! You can also contact @lukmarcus about content directly on steem.chat or join our steem.chat SteemProjects channel.
Steem on!
Thanks guys. Looks great.
We've published your article on TIMM!
You've also been tipped from TIMM.
You have a typo there: It's @helo not @help
Thanks for mentioning! :)
corrected :) Thanks! :)
Thanks for looking out for me.
Sorry - my mistake :(
It’s ok, @mkt does need help once in a while.
I get so caught up in the projects I am working on that it is nice to see some of the other projects being worked on. I'm currently working on @timm for @anotherjoe and company. I am also working on some other stuff that I imagine will be in announcements once they are ready. If anyone ever gets stumped by something feel free to contact me. I am generally hanging out in discord.
thank you!
good work)
What is the Golos blockchain?
Golos is the alternative for whole Steem blockchain - it was forked early and adapted mostly by Russians - https://golos.io/.
Nice sorry I'm asking you all the questions, what are some benefits to Golos compared to steemit?
Thanks for all the info btw.
Imagine Steem but only for one language community. Russians adapted Steem to their needs and they created new token - Golos. You can see it on CoinMarket.
Benefits? Larger Russian language audience :)
Thanks
Your level lowered and you are now a Minnow!
Do not miss the last post from @steemitboard:
SteemitBoard and the Veterans on Steemit - The First Community Badge.
Bubble Chart
A Bubble chart is a variation of the Scatter Plot. Aggregated data is grouped by dimension into circles displayed on an x/y axis. Additional measures change the size or color of the circles. A Bubble chart can represent up to four measures for your chosen dimensions (x, y, size, and color).
Features Quantity Notes
Required Dimensions 1+ Minimum 1, no limit, null dimensions optional.
Required Measures 2-4 Measure 1 = x axis, Measure 2 = y axis, Measure 3 = bubble size, Measure 4 = bubble color.
Use a Bubble chart to show a correlation between the x measure and the y measure. When you do not expect a correlation, you can use a Bubble chart to understand the distribution and influence of multiple factors.
Bubble Chart Examples
Create a new Bubble chart. Choose a Data Source. This example graphs employment statistics for all 50 United States for the years 1980-2015. The data is available at the University of Kentucky website.
State_name is a handy dimension for this data. Use the average Unemployment_rate as the X Axis, and the average Unemployment total for the Y Axis. Increase the # of Groups to 50 to create an individual bubble for each state.