Crypto Markets Update 12/25/17
Cryptoland
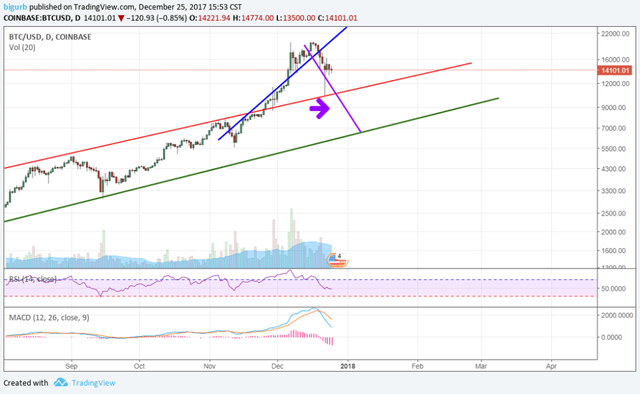
Here is what I am seeing in cryptoland. As I have said before I view technical analysis as an examination of the history of the chart. Look at what has happened in the past and look for history to repeat itself. It often does. Each individual stock or cryptocurrency is it’s own “market”. When a market changes character that is a time to be cautious. BTC recently had a major change in character as you can see below:
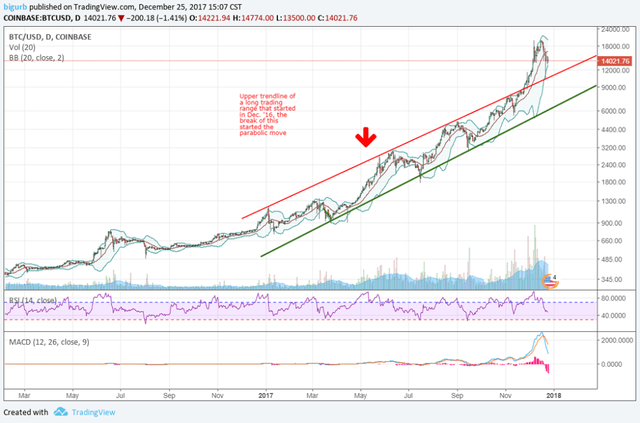
The upper trendline break signified a major change in the past patterns of this particular market. Then a new short term trendline was established and it broke through that as well, going to a state of irrational exuberance:
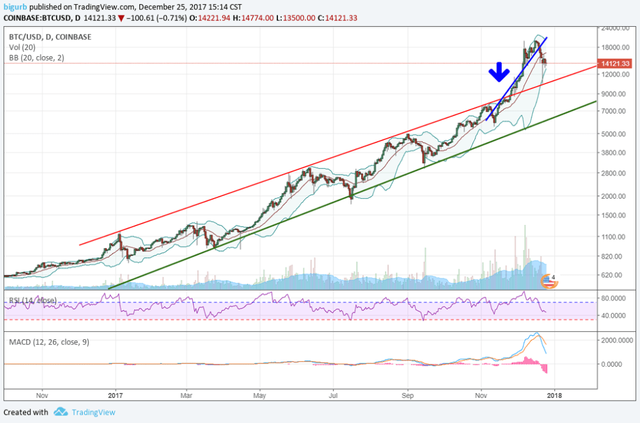
Notice how RSI and MACD go to extremes? The break through the upper bollinger band also signified the extreme nature of this move. Capitulation type volume can be seen in this range.
It is interesting to see that the top correlates with the start of the futures trading on the 18th:
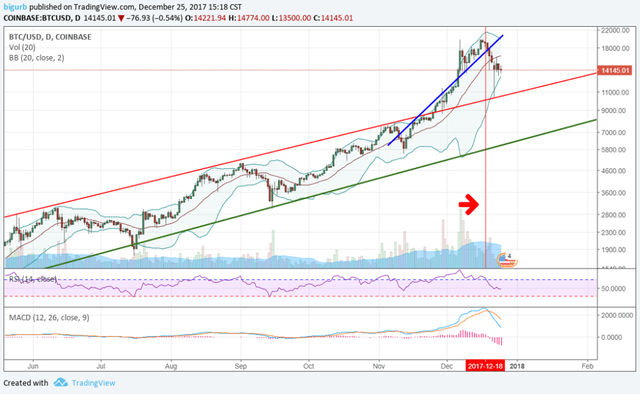
If you zoom into the hourlies, you can see a head and shoulders top further strengthening the top argument. I will leave that as an exercise for you.
BTC has a long history of boom and bust cycles, AKA bubbles. Lets look at a few:
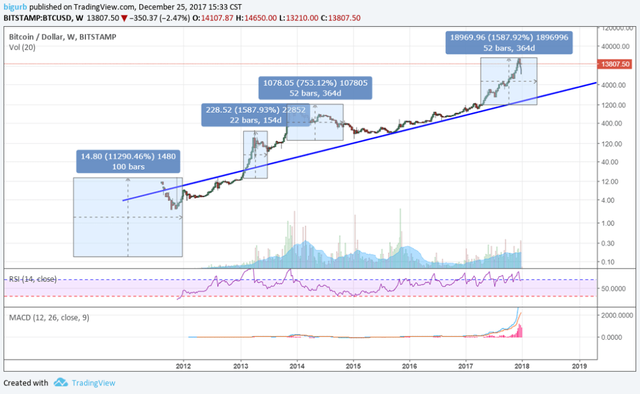
I do want to say that this representation is not perfect, as it does not have all the data for BTC price historically. There are better representations out there. Google them or this is a pretty good blog post on it(Near the top of google results). I do want to point your attention to the big blue line in this chart. While anything is possible, I would be surprised if we go below that line. Depending on how long we retrace that could be anywhere from $2000-$4000. Another key take away is each successive bubble is smaller in percentage terms. That is not surprising as simple math tells you as the numbers increase, the percentages decrease. That is what is attractive about alt coin markets. A third big takeaway is that when the bubbles pop, they never retrace below the last bubble high. The last bubble high was around $1200.
That is all well and good for us to look at the past and analyze it. Hindsight is truly 20/20. But looking at the past is all we have to go on. So where does that leave us? Where do we go next?
I like to look at trading as a probabilities game. I think at a minimum a re-test of the long standing uptrend line from the very first image is likely. I would put a higher probability of us actually breaking through that and going back into the trading range. I could very easily see us making an intermediate or maybe even long term bottom anywhere from midway between the two major trend lines on the daily to the bottom of that trading range.
With all this in mind, I have my layered orders placed along this big, beautiful purple line:
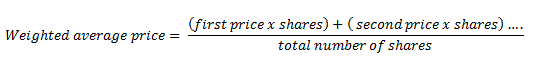
To be exact, my orders are currently at: 9600, 9000, 8400, 7800, 7200, 6600, 6000. My average price paid if all orders fill would be 7350. Here is how I calculate that. Man, I am giving all sorts of free bees today, I must be in a festive mood.
( )
)
from the motley fool website
With an average price of 7350 I would want to place my stop around 5500 which the next major support I am seeing below the big green bottom trend line. For those keeping score at home, that is about a 25% stop loss. Much bigger than I would use in another market, but large stops are needed for these volatile markets. Keep in mind, if you have read some of my other posts, I do not use hard stops instead I will allow a market to move below my stop for a set amount of time. If the stop level can be reclaimed in that amount of time, I will stay in the position. This has turned many losing trades into winners, with the occasional large loss.
As said before, anything can and often does happen. It is possible we have already seen the long term bottom, though I would say that is unlikely. It is also possible I get stopped out. If that happens I would re-examine the situation. Likely I would attempt to re-layer in with an average price of 2-3K.
This is an example of a longer term trade. Shorter term trades would be managed a little differently. I do not always layer into short term trades.
I have often been using a 10:1 risk:reward ratio on crypto trades. On BTC, and some of the larger alts I am experimenting with trailing stops instead of hard profit targets.
BTC Fundies
All of this in mind, from a fundamental perspective, I have turned somewhat bearish on BTC. I think there are a lot of alts that on the surface that are vastly superior technology wise to BTC at this point. Incredibly slow transactions speeds and high transactions costs, coupled with capital gains taxes when converting to native currencies does not equal a usable currency. I get the store of value argument, that makes sense. I don’t get overly into fundamentals, but that is a small factor for me. The main reason I am still looking to buy BTC at this point, is to trade alts. With segues me into the next discussion…
Alt Bull Market
The alt market has been great lately. I hope many of you have been participating. My account has grown at the fastest rate to date in the last few months. The trades are too numerous to mention, but here is one very recent one:
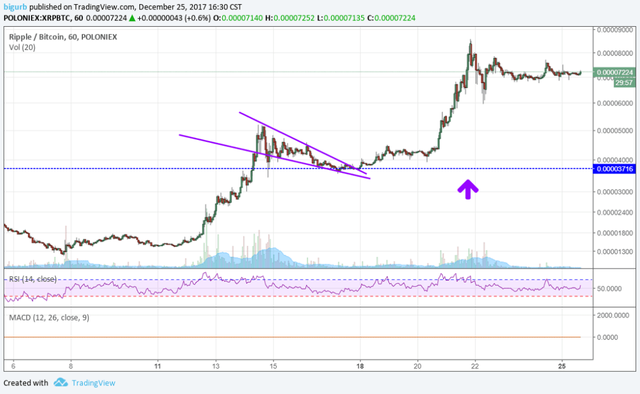
I bought the lower trend of this developing flag pattern, at 3716 satoshis. I love to buy the lower trend line of chart patterns as they develop. Most wait for a break above the upper trend, but that is not my style. For this trade I am trailing my stop higher as this moves up. My stop is already above my entry price. I actually have a larger entry on XRP below this level as well.
There is a history of the alt markets de-correlating from BTC and making big moves higher while BTC struggles. Alts have been largely beaten down for the last 6+ months. I do believe there is more upside room on many of the alts, though risk:reward is not quite as good as before. I would suggest continuing to be aggressive on the alt market, just please be mindful of risk.
BTC Future
In terms of BTC, if exchanges begin to put more ETH, or even BCH pairs in to trade with I will consider drastically reducing my exposure to BTC. I would change my tune on that if BTC addresses it’s underlying fundamental issues. Until that point, I view BCH, DASH, ETH, XRP, IOTA, etc. as far superior tech wise.
Disclaimer
The advice provided on this website is general advice only. It has been prepared without taking into account your objectives, financial situation or needs. Before acting on this advice you should consider the appropriateness of the advice, having regard to your own objectives, financial situation and needs. Where quoted, past performance is not indicative of future performance.
SpeculateFreedom.com disclaim all and any guarantees, undertakings and warranties, expressed or implied, and shall not be liable for any loss or damage whatsoever (including human or computer error, negligent or otherwise, or incidental or consequential loss or damage) arising out of or in connection with any use or reliance on the information or advice on this site. The user must accept sole responsibility associated with the use of the material on this site, irrespective of the purpose for which such use or results are applied. The information on this website is no substitute for financial advice.
Congratulations @speculatefreedom! You have completed some achievement on Steemit and have been rewarded with new badge(s) :
Click on any badge to view your own Board of Honor on SteemitBoard.
For more information about SteemitBoard, click here
If you no longer want to receive notifications, reply to this comment with the word
STOP