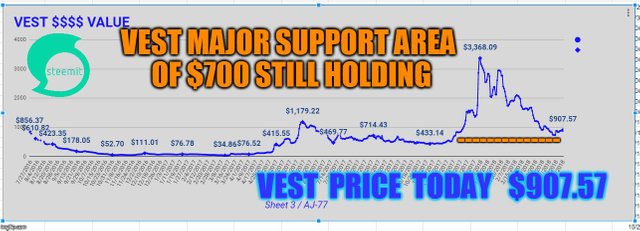
$907.57 VEST VALUE TODAY <<>> April 13 , 2018 DEEP WAVE 4 DOWN
🐒
Steem Power is essentially Steem held in a fund. Vests are Shares in that fund.
Some Vest Value Price History
🐒 Lowest Vest Value Price since July 27, 2016 was recorded on March 13 , 2017 $34.86 per Vest
🐒 Highest Vest Value Price since July 27, 2016 was recorded on January 6 , 2018 $3,368.09 per Vest
🐒 The Vest Value Today is $907.57
Below Line Chart
🐒
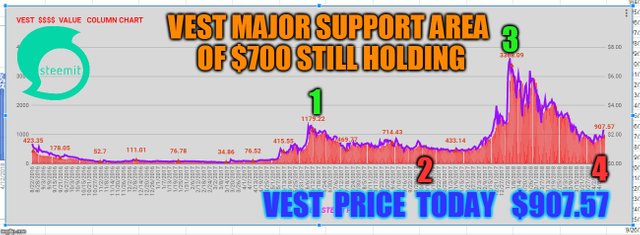
COLUMN CHART below
🐒
SUMMARY
🐒 The Vest value fell as low as the $735 level on April 3rd and April 4th and that is just above the major support area of $700 and today has advanced to $907.57 . The major support area of the $700 area should hold in my opinion . I believe the vest price chart is in a deep 4 wave correction according to elliott wave theory .
🐒
DISCLAIMER : This content is for informational, educational and research purposes only.
Please get the advice of a competent financial advisor before investing your money in any financial instrument.
It is strongly recommended that you consult with a licensed financial professional before using any information provided here . Any market data or news commentary used here is for illustrative and informational purposes only.
Trading involves a high level of risk. Future results can be dramatically different from the opinions expressed herein. Past performance does not guarantee future performance. Consult an investment professional before investing.
All ideas , trade signals , opinions and/or forecasts are for informational, educational and research purposes only and should not be construed as a recommendation to invest, trade, and/or speculate . Any investments made in light of these ideas, trade signals, opinions, and/or forecasts, expressed or implied herein, are committed at your own risk. I am not an investment advisor, information shared here is for informational, educational and research purposes only and not a recommendation to buy or sell anything .
Please voice your opinions in the comments below.


🐒 The Vest value fell as low as the $735 level on April 3rd and April 4th and that is just above the major support area of $700 and today has advanced to $907.57 . The major support area of the $700 area should hold in my opinion . I believe the vest price chart is in a deep 4 wave correction according to elliott wave theory .
🐒
🐒
🐒
DISCLAIMER : This content is for informational, educational and research purposes only.
Please get the advice of a competent financial advisor before investing your money in any financial instrument.
It is strongly recommended that you consult with a licensed financial professional before using any information provided here . Any market data or news commentary used here is for illustrative and informational purposes only.
Trading involves a high level of risk. Future results can be dramatically different from the opinions expressed herein. Past performance does not guarantee future performance. Consult an investment professional before investing.
All ideas , trade signals , opinions and/or forecasts are for informational, educational and research purposes only and should not be construed as a recommendation to invest, trade, and/or speculate . Any investments made in light of these ideas, trade signals, opinions, and/or forecasts, expressed or implied herein, are committed at your own risk. I am not an investment advisor, information shared here is for informational, educational and research purposes only and not a recommendation to buy or sell anything .
🐒
good job friends success continues
Good informative news.thanks for share next post
It’s good the way it coming up lately , hopefully we should see more progress in few days time . Thanks @me-tarzan for always sharing the good news.
There is great expectation for the value of steem. it is expected that its value will increase considerably.
🐒 The Vest value fell as low as the $735 level on April 3rd and April 4th and that is just above the major support area of $700 and today has advanced to $907.57 . The major support area of the $700 area should hold in my opinion . I believe the vest price chart is in a deep 4 wave correction according to elliott wave theory .
🐒
🐒
🐒
DISCLAIMER : This content is for informational, educational and research purposes only.
Please get the advice of a competent financial advisor before investing your money in any financial instrument.
It is strongly recommended that you consult with a licensed financial professional before using any information provided here . Any market data or news commentary used here is for illustrative and informational purposes only.
Trading involves a high level of risk. Future results can be dramatically different from the opinions expressed herein. Past performance does not guarantee future performance. Consult an investment professional before investing.
All ideas , trade signals , opinions and/or forecasts are for informational, educational and research purposes only and should not be construed as a recommendation to invest, trade, and/or speculate . Any investments made in light of these ideas, trade signals, opinions, and/or forecasts, expressed or implied herein, are committed at your own risk. I am not an investment advisor, information shared here is for informational, educational and research purposes only and not a recommendation to buy or sell anything .
🐒