STEEM PRICE TRENDS USING THE STEEMIT OSCILLATOR
10 / 17 / 2016
THE ME-TARZAN STEEMIT OSCILLATOR Developed to hopefully help to identify steem price trends . Only time will tell how well the oscillator will work . The oscillator is a @me-tarzan proprietary system .
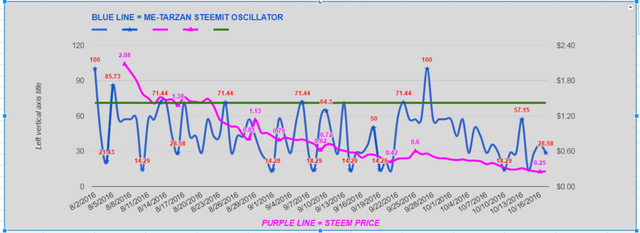
How does it work : The BLUE LINE is the actual oscillator that can move between 0 and 100 . The lowest reading is 0 and the highest reading is 100 on the oscillator . The PURPLE LINE is the steem price . The GREEN LINE is the bull bear line . When the blue oscillator line is above 69 ( GREEN LINE ) for several days the trend for steem price should begin an uptrend . When the blue oscillator line is below 69 ( GREEN LINE ) for several days the trend for steem price should begin a downtrend .
ME-TARZAN STEEMIT OSCILLATOR
BLUE LINE = ME-TARZAN STEEMIT OSCILLATOR
PURPLE LINE = STEEM PRICE
GREEN LINE = OSCILLATOR BULL BEAR LINE
.
SUMMARY
If you study the chart you will see that the oscillator has only been above the bull bear line for one day at a time . I think if the blue oscillator line can get several days above the green bull bear line we could begin an uptrend . As you can see the oscillator has been in bear territory for awhile now .
DISCLAIMER : This content is for informational, educational and research purposes only.
Please get the advice of a competent financial advisor before investing your money in any financial instrument.
It is strongly recommend that you consult with a licensed financial professional before using any information provided here . Any market data or news commentary or the ME-TARZAN STEEMIT OSCILLATOR used here is for illustrative and informational purposes only.
Please voice your opinions in the comments below.
If you find any of this information useful to you. Please upvote and follow. THANK YOU
The STEEMIT OSCILLATOR remains in bear territory .
And we dip below the October 11 lows?
Steem Price Next stop $0.18 to $0.19
I wonder, if enough people think and say this, does it become true? If there are investors on the sidelines right now and they are waiting to get in, why would they buy now? Also seems like we could just as quickly shoot up again due to most of the supply being in Steem Power. Seems like this may be a volatile road with fast spikes up and slow bleeds down.
"Seems like this may be a volatile road with fast spikes up and slow bleeds down."
Could not agree more with this.
Thank you me-tarzan for your informative posts RESTEEMING
Thanks again otisbrown
Enjoy the information this tool provides, thanks!
Thanks scaredycatguide I hope it helps us all Know when to start buying steem
Your new Steemit Oscillator looks like a great tool
Perfeito