Bitcoin reaching ATHs
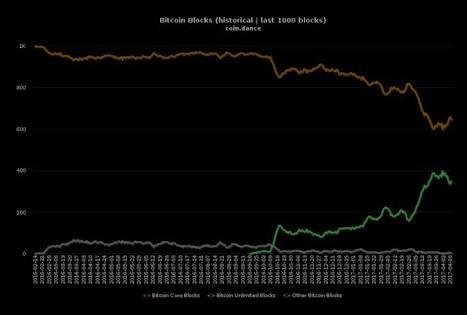
Nodes however, continue to heavily favor Bitcoin Core and Segwit.
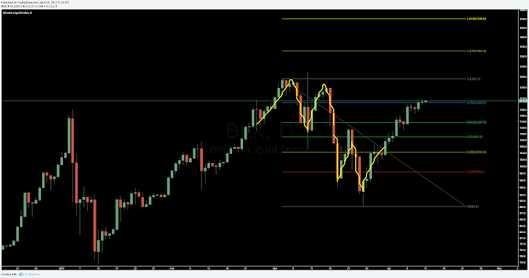
Additionally, the price is again flirting with gold parity, which always grabs flashy media headlines but is largely meaningless. What is more important is the psychological realization that a digital asset could be worth more than a physical asset relied upon for the past few thousand years.
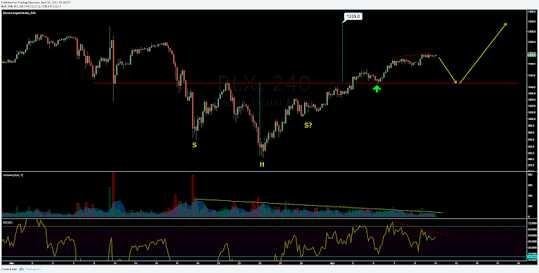
The bullish reversal pattern, inverted head and shoulders, continues to play out but a few questions have emerged. The left shoulder of these patterns is often diminutive, but this structure may negate the idea of an inverted head and shoulders entirely.
ihs.png
With a chart pattern breakout, there is normally a large spike in volume at the resistance or support line signifying definitive resolution of the pattern. That spike in volume has not yet occurred. Furthermore, once a break of the horizontal resistance occurs, there is often a throwback to that horizontal level to confirm support, which may have already happened (green arrow). There is also a growing bearish divergence on the Relative Strength index (RSI), a momentum oscillator. This divergence suggests that price is rising on less momentum and predicts a reversal over continuation. Should this divergence play out, I’d expect a retest of the $1100 support. However, a higher high in price and RSI would negate the divergence.
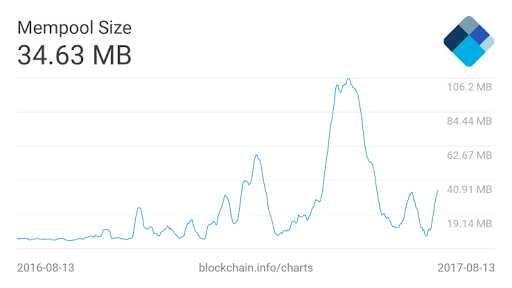
The Bitcoin network hash rate has fallen slightly, but is still projected for a 2.15% difficulty adjustment in 10 days. This would bring the cumulated difficulty change +113.74% since January 2017.
In order to assess where the current trend is relative to recent prices, I use the Pitchfork, with an anchor drawn from the Bitfinex hack. The median line (red) of the Pitchfork gives the expected mean of the trend. Price will continually attempt to return to this diagonal. Each diagonal of the Pitchfork can be thought of as a potential reversal zone or support/resistance line. The upper yellow diagonal zone being ‘most overbought,’ or the top bounds of the trend, and lower yellow diagonal zone being ‘most oversold,’ or the bottom bounds of the trend.
Price is currently pulling back from the upper diagonal resistance after briefly peaking above, which increases the validity of the diagonal resistance. Should price break the upper diagonal resistance, this would invalidate the Pitchfork and a new Pitchfork would need to be drawn.
@hajialamin
This is very detailed estimation, thank you for sharing.