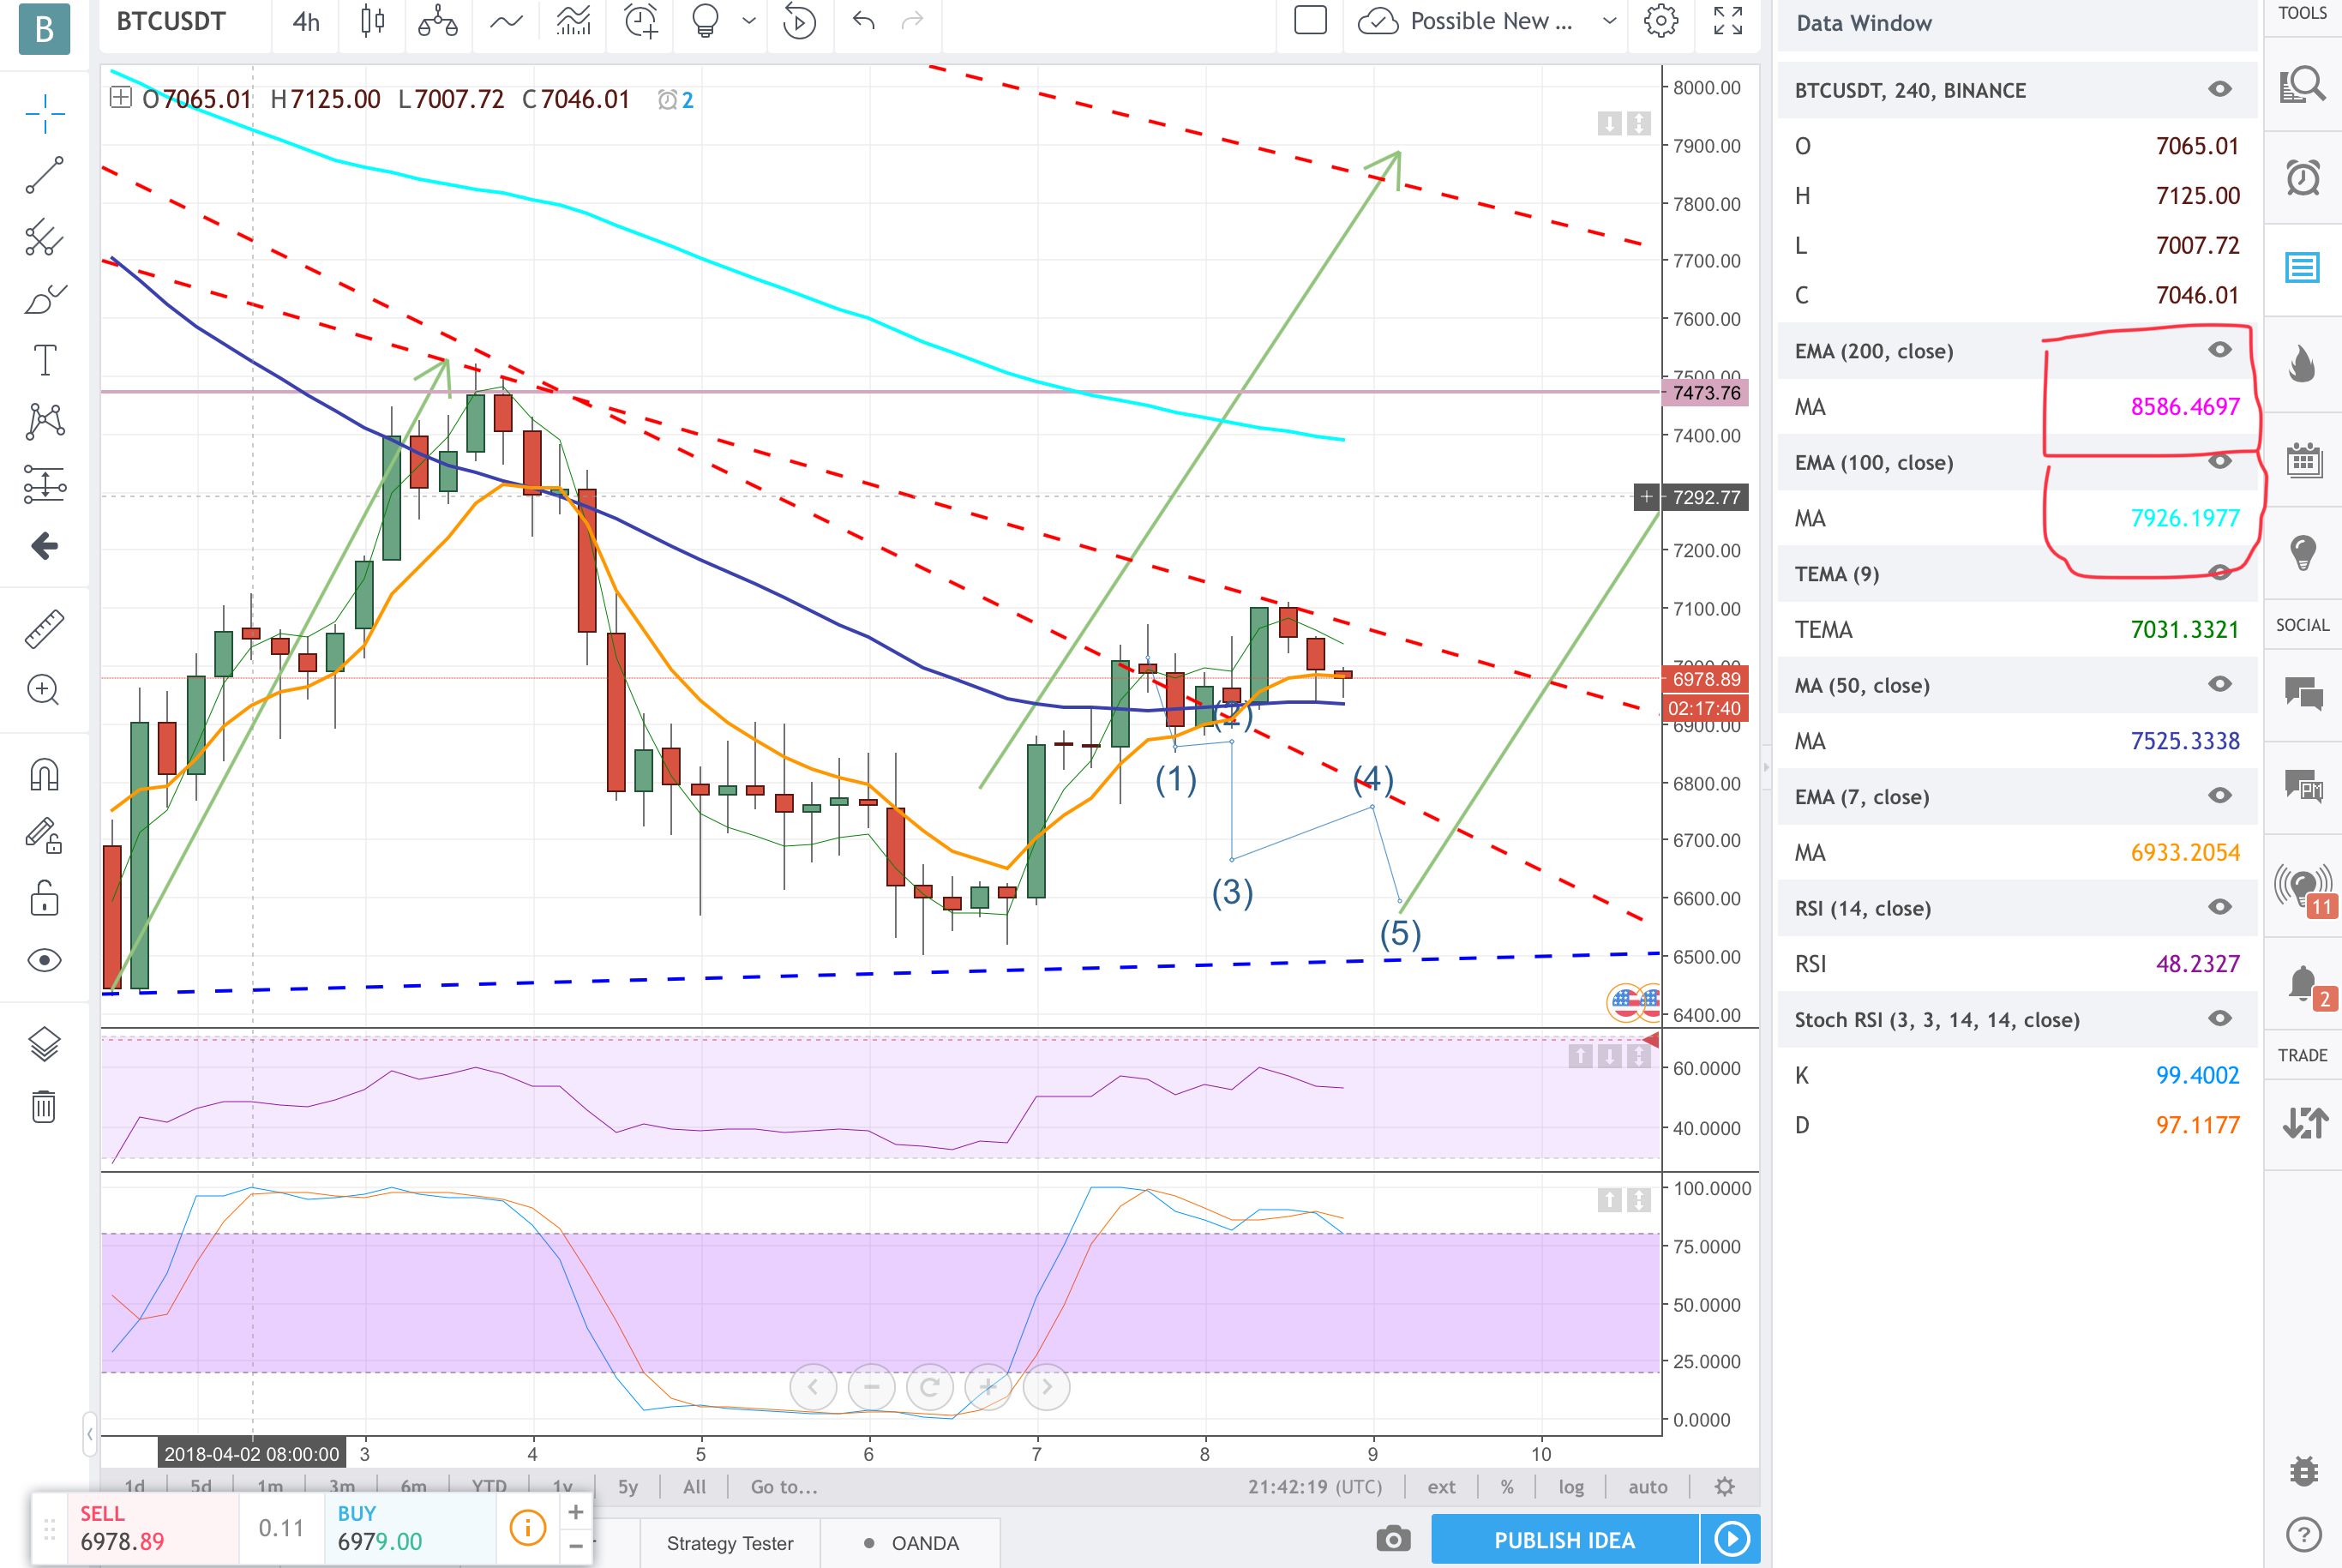
04/9-10/18 Bitcoin Volume Profile and Future Investment Strategy

Volume Profile is vital tool that shows the most traded prices for a particular time period. It plots trading volume as a histogram on the price scale, so you can easily identify price levels where most trading took place. It is important to see in this graph the repetitive nature of human beings. All prices aside lets go beyond number TA and look at the times that people are trading. These areas of high volume are happening late hours in Eastern Time (ET) and early hours of China Standard Time (CST) . In these Four hour candle sticks we can see high volume and high price volatility in the first STICK of the day aka (MidNight to 4 AM ET) which is actually just carrying on from the previous FOUR hours. Taking us back to the previous day 8PM to Midnight. Obviously Binance is a Chinese exchange and US traders should keep that in mind.
Unfortunately for us US traders that means we have to be really cautious thru-out the middle of the night. STOP-LOSS will save you a lot of money. On another note Bitcoin -0.52% is still in no mans land, if you know someone who's telling you where bitcoin -0.52% prices are going don't listen they are lying. Its the Wild Wild West in here and my guns are blazing on the sell button. I would advise anyone on a long position to short. Lets make money on the fall and the rise of bitcoin -0.52% . Bitcoin -0.52% will go up eventually I hope I think I even want to say I know, but one this is certain in this market and it's : WHEN IT RAINS IT POURS ! We might be on the cross road leading to a bullish divergence but don't fool yourself with confidence. Play the smart game buy back low!
Link to my full graph:
https://www.tradingview.com/chart/BTCUSDT/NnrmykPJ-04-9-10-18-Bitcoin-Volume-Profile-and-Future-Investment-Strategy/