Update S&P500
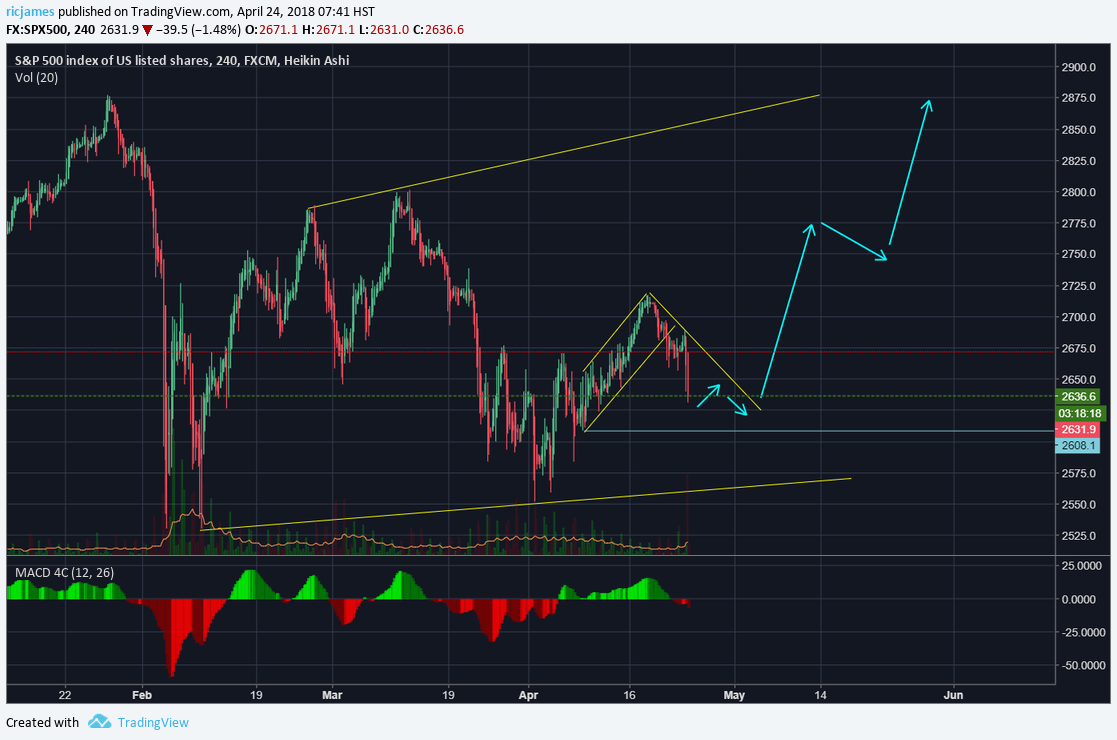
Today, the S&P took a big hit dropping 35 points or around 1.32%. However, if you have been following my recent posts, I projected this drop in my last post on the S&P.
https://steemit.com/steem/@ricjames/weekly-update-s-and-p500
Now like in that post I am projecting a healthy recovery and push to the top. Now this move could continue to fall and we would worry that it might not reverse if it takes out the prior low of the channel (the blue line).

So in the short term, next couple days to a week, we should see some sideways action and test of the resistance line before a possible breakout. If you are looking at going long S&P I would wait for it to break out or start to consolidate a little more in case this move continues to fall.
Once you are in the trade, the stop loss would be the blue horizontal line that would signify the start of the channel and we shouldn't see a break of that.
If there is a break of the blue horizontal line I would wait and see if it bounces off the lower support line which would tell us whether or not we are expecting a reversal. Either way the trade you were looking for would have been broken so you should have gotten out.

If you are looking at playing options, it wouldn't be a bad idea to buy after a drop like today and if it continues again tomorrow pick some more up. I still am bullish on this pattern as this was a normal impulse move down after a break of the channel.
As always I hope you have a great day and an even better one trading. If you have any questions or concerns leave them in the comments below and I will get back to you in a timely manner.