$STEEM/BTC Technical Analysis
Hello everyone, some of you may know me by my nickname OZmaster,
well I opened this account in order to post Technical Analysis and decided to start of with #STEEM, seems appropriate ;)
So let's begin,
The following are charts from the Bittrex exchange,as it has the longest history i decided to take that one, after each chart(picture) will come a comment with explanation. Before each chart I will make a "legend" with the goal of the community having it easier to understand.
Legend
(LGDL)Light green dashed lines - "old" high's which should act as support
(LBDL)Light blue dashed lines - "recent" high's which should act as support
(PDL)Purple dashed lines - "recent" low's which should act as resistance
(PYL)Pointy yellow line -bottom part of recently broken triangle border
(YL)Yellow lines - "current" holding triangle borders
(RL)Red line - All Time High (ATH)
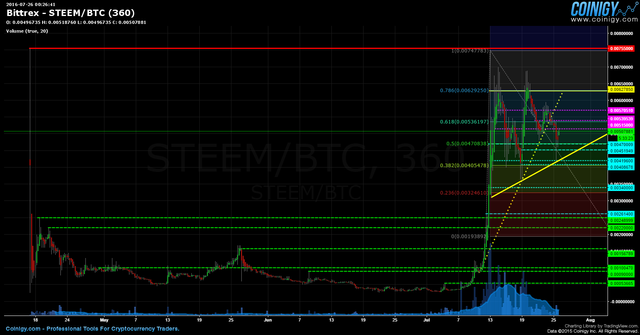
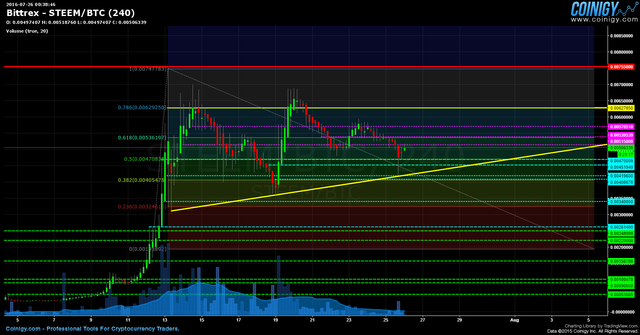
So here we have the full history of STEEM/BTC, first I want you to get an overview of the whole chart as well as the areas I will talk about.
As you can see i marked some tops/highs from before Jul(LGDL), those are "old" support lines(rather zones around those prices) where there is buy support to be expected on the order book, however those are "old" high's, high's which were made before the big pump accured.
A little bit above and to the right of the LGDL u can see the LBDL , those are the "recent" high's, the ones that are important for the trading range we are in right now.
Above the LBDL you can see the PLD, those are "recent" low's, the resistance lines in the trading range atm, around those lines the price has a higher chance of repelling back down.
PYL is the recently broken border of the triangle which resulted in the price going downwards as seen on picture.
YL are the border lines of the current triangle, meaning the price is expected to respect those lines and bounce of from them, breaking up or down with a hard move towards the end.
The RD is the All Time High line, at this point this is the highest and strongest resistance point ever reached by STEEM.
I'm gonna leave the LGDL and the time before July 10th for later and focus on the current situation, but will shortly get back to them later.
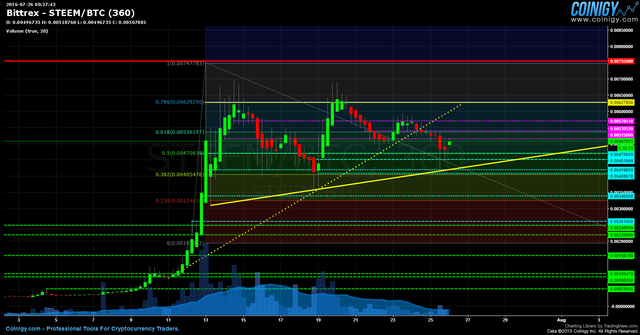
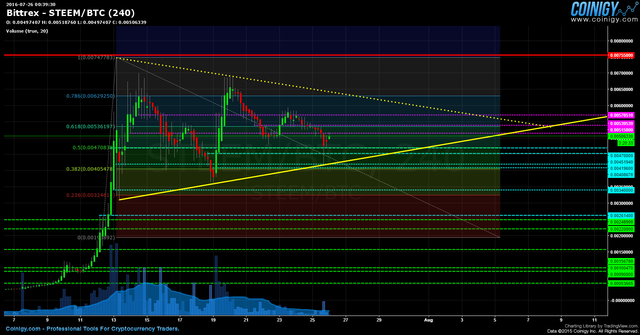
Now let's take a closer look to the time period from July 10th onward. Below you will see 2 identical charts, one with 6 hour candle's and one with 4 hour candle's, starting off with the 6 hour one.
(6h chart)
(4h chart)
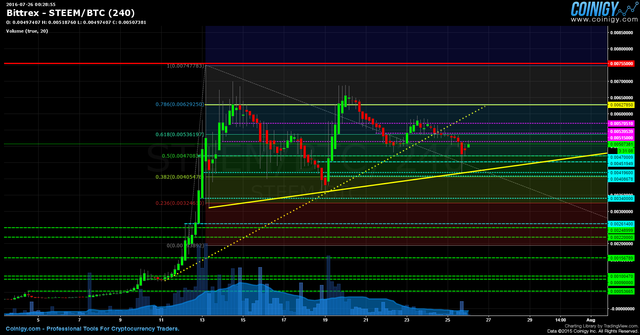
There is nothing much to comment no those chart's, just analyze them for a few minutes,get a feeling of where we are at in the market right now, you will see how the price "respects" the YL triangle borders, those are the "main" one so to say, using the other lines to slowly direct the trend.
In the coming 2 pictures I will explain the bullish as well as the bearish scenario
1.) Bullish scenario
As you can see I deleted the LGDL and one (last/lowest) LBDL, raeson being is that I am going to explain the bullish scenario, aka the price going up.
The price keeps trading between the 2 YL borders, refusing to break down, using the LBDL's and later possibly also the PDL's as support points.
Slowly progressing upwards the price will tackle the upper YL border, if there is a successful break, we can expect and immediate attack on the RD All Time High (as there is no significant historical resistance nor support in between), most likely breaking it, making a new ATH, and setting a new floor on the top YL border.
2) Bearish scenario
The price breaks the bottom YL borderline and makes a new low at around ~0.034 LBDL, IF the mentioned LBDL doesn't hold the price is likely to break down towards the last LBDL and even down into the LGDL, as the price pump after July 11th was hard and the price was climbing hard without backing down there is no strong support level in between the 0.0034 LBDL and the 0.0015 LGDL.
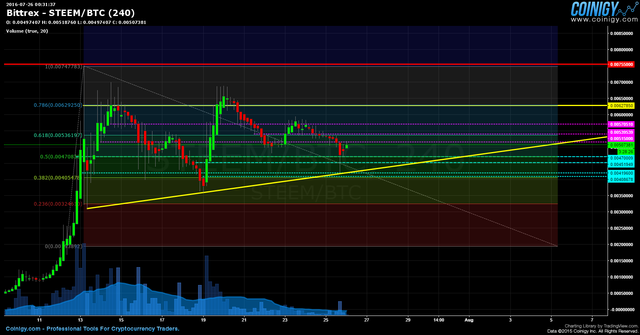
BONUS CHART
another possible form of the triangle, indicating the possibility that the price will trade towards the end of that triangle before making a decision of going up or down.
BONUS COMMENT
$STEEM is somewhat special, and therefor accurate predicting of it's price going up or down sharply in the near future is quite hard, the reason of all that being the business model behind the whole platform, STEEM, SBD and STEEM POWER. If the business model is good it can totally ignore every law of TA. I will write a whole post on that matter in the near future!
If anyone has any questions or need's help fell free to ask, I will try to explain as fast and as best as I can.
Critics, comments, reply's, counters, advice's, etc,,, are always welcome!
Have my charts helped you in any way?
Are there more people who are doing TA?
Disclaimer I am showing multiple scenario's on the price movement, in the post it'self I do not take any stance, either bullish or bearish. I am not responsible for either you're winning nor you're losses upon trading!
Kind Regards, OZ :)
you got some mad charting skills bro! why aren't you posting these daily for us? please start.
Thanks alot for the compliment, I will defo try and do my best to keep this up on a daily basis :)
Since you invite critics :)
Sorry but technical analysis isn't quantitative.
What you're experiencing is apophenia.
Price analysis makes absolutely zero sense if not based on a positive ev strategy (e.g. using normal distribution models, like market-makers do).
Moreover, I would add that price analysis also makes absolutely no sense if the orderbook isn't taken into consideration or perhaps even if you don't singly consider the orderbook.
Spoofing isn't illegal in crypto-markets, try placing an order at a particular trough and and see if it gets filled.
Thanks for your contribution though, nice to see some traders...
It's little more than reading the tea.
To add on that, this kind of analysis are useless (if not dangerous) do most investors. Regular people must focus on value and not price. If speculating on short term price variations, most people will, most likely, lose money.
Check out my price analysis for Steem coin. https://steemit.com/steemit/@cryptocurrency1/steem-coin-price-analysis
Yep. Best investment advice I've heard on this.
Then Regular people should run from crypto. We have yet to see solid value in this entire industry.
In some cases, yes. Although, there is value in the inovation, in the ease of trading and value transfer, value in governance and value in usability.
This makes it woth it for the regular (non financial) person to invest some money on it. Risk control will bo on how much and on which coins.
There is always some speculation in any investment, BUT, investing is different from speculating.
why?
Apart from the risk factor that can vary on the nature of the investment, I would say that speculation is gangling on the price variations of an asset, investing is accumulation of capital on a asset based on its underling value (even if it is more or less intangible).
In speculation what matters the most is price, in investing what matter the most is value.
i love the bullis reindeer man
Hey! I drew my own chart, I wonder if you'd like to give me some feedback?
Here's the link! Enjoy!
Thank you for your very interesting analysis! I'm not much of a technical trader, but I love seeing it explained clearly as you have done, so thank you.
We just placed a trade based on the spread between Steem/USD and Steem/Steem$ and we expect to earn roughly $37.82 as a result. Here's the post if you're interested:
https://steemit.com/money/@trending/case-study-how-to-trade-market-distortions-to-profit-with-steem-and-bitcoin-i-put-my-money-where-my-mouth-is
Good job man.
Nice post and thanks for info. But u can give info about sites with trade Steem coins?
Agreed @the.whale this is an amazing post. @ozchartart all of this omnipresent transparent information about the world of Steem gives users that want to be involved the feedback they need. I have told everyone I know about Steem emphasizing the need for original content and the notion of an online community forum that will show so much insight into media markets and 2016 economics. I am so excited about the future and look forward to seeing how the return of students and the cooling temperatures effect user involvement.
Thanks so much. I am grateful and gladly upvote.
H
Thank you for this constructive comment, I can agree with you on many things :) there are many aspects of steem that yet have to be tested, but so far it is rly not looking bad :)
Technical Analysis Waves.

haha! Isn't that a semi-bullish head and shoulders continuum? If I ever saw a stronger buy signal...
now thats what i call a breakout xD
Definitely. I agree with you fully.
A daily update would be great. And I'm sure you'll benefit lots from it as well.
Will give my best to start it a keep it running :)
Yes this was quite good made. A realy well done jobb :)

The analys i dont know was cool. Couse i only use Bittrex and Coinmarcetkap to see buy sells and prise chart.
I hope for more analyze like this @ozchartart ;)
Keep up the good work, i would gladly vote this :)
um where is the uncensored version...
Yeah these charts are bad@
Thanks for the update, and I agree with @the.whale a daily or even weekly post like this would bring me and I'm sure MANY other people back to your page consistently :D
https://steemit.com/steemit/@minion/youtube-vs-steemit-enemies-or-siblings
[IMPORTANT] This post covers the Similarity between YouTube and Steemit as well on How to use Steemit and It's OFFICIAL CONTENT RULES.
Yes, please do @ozmaster. This puts everything in perspective. Looking forward to your post on why STEEM might be untouchable by the laws of technical analysis.
Great stuff, and incredibly useful. This is what we need!
the reason that rise and fall is unknown?
thanks guys..
own share trading knowledge
the possibility of a sideway direction, looking for the point of purchase and then climbed to trend up
because it has been a breakout from the initial position
Technical analysis doesn't mean anything though.
Great TA, next time you should commit to a bull or bear scenario.. Keep these coming
Tnx silver! I think i will keep my personal stance/ opinion for a separate section at the end or even better the comments :)
I was wondering the same thing. Do you think one scenario is more or less likely to occur? What factors do you think will play into which direction it goes?
To be honest i cannot rly lean towards any scenario, the reason beeing that the business model of steemit influences the market so much, another beeing that the technology , the platform, aswell as the business model are still in "beta". As mentioned in my post i will make a whole separate post on that matter in the near future! Thank you for asking!
good work as always!
I concur :)
Excellent analysis. Good luck to you
Thank you and thank you, if you are looking for more, be sure to check more often into the @ozchartart blog :)
This is good stuff. I'll be following.
Thank's, I'll make sure i keep'em coming
nice post!
Excellent analysis ,thank you @ozchartart
Thanks, no problems! will do my best to deliver good charts to you guys WITH explanation and help if needed!
Hi @ozmaster you the best
wow cool men,
An upward trend is a good trend.
I rly hope it for steem
Really appreciate you putting this together since I'm very new to trading crypto. I have some basic understandings of trading, but these chart lines help immensely for getting insight into how the market could behave.
There's a hardfork tomorrow that will remove the liquidity rewards that some whales have used as an "exploit" to gain 1200 STEEM daily. Due to the removal of these rewards (until a better system can be implemented) @jl777 was predicting the price could double after Tuesday. So, I'm betting that STEEM hits ATH by Friday. Well, one can hope anyway :)
Someone suggested you post these daily, but that might get to be a bit of work. It'd be nice to at least get this weekly, or monthly. I'm sure it'll be worth the effort!
to be honest I don't mind posting charts on a daily basis as i enjoy making them, those the name for the account "@ozchartart" ;)
If you happen to have any questions regarding understanding or terms feel free to ask, I know on the beggining it can be rly hard to keep up with everything.
Regards, OZ
Well done with the TA, as always. Bookmarking your nickname page so I can continuously refer to you charts and explanations as needed.
Thank you my friend! If any kind of question pops to ur mind feel free to ping me!
You know I will!
Good analysis, Oz!
If it's about SBD would it differ much?
Did'nt realy do a STEEM/SBD chart yet, it's quite a good idea to make one! thanks!