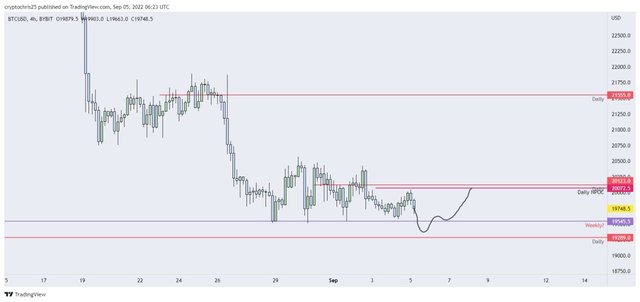
BTC/USD TRADING CHART
BTC/USD
Price is still in its sideways range ($19500 -$20500), with Bearish CVD still building up. ( See next post)
This lack of volatility makes me believe that a big move is imminent.
We now have a weekly level formed at $19545, an area the bulls have defended on three separate occasions.
We can now assume that a lot of stops (liquidity ) are located below this level. This could be an opportunity for the price to take the stop losses located below $19500.
In the above post, I have drawn a potential scenario that could play out; the reasoning behind this is that a dip under support followed by a swift recovery would wreck most traders.
We also have a daily level located at $19289, which is also the last line of defense for the bulls.
PS: Not a financial advise.
Do your research very deep and take necessary decision at your own risk.
Wishing you a successful trading day
You can also find this post on my hive account at same username. Follow for more valuable content on Crypto
