Steem is going to single digits here and why that is good news.
You heard it here first folks, fear not, panic not. This is actually going to benefit the smaller fish here most. With STEEM at 2 cents I can take my 350 SBD and buy a huge share in the Steemit platform and despite my discontentment with a certain few whales here that is just what I plan to do. To the shagrin of some greedy whales hoping to hold the price up for 3 str8 months while they dump on faithful Steemians hoping the latest whale pump to just under the "breakout zone" of 20 cents is "The big one" and having their hopes dashed by a big holder who simply needed their panic buys for liquidity.
Dump STEEM Crash STEEM SELL STEEM. If you love and want more STEEM.
IF Steem goes to 2 cents an account valued at 200k now would be valued less than 28k. Giving market manipulators less sway. If the liquidity does not massively increase simply spending new money as a whale to prop up a coin is a losing battle. That is where pumps come in. The last unexplained 5 min pump to 18 cents. That was a whale selling. But first they had to buy. To get enough orders from the hype for him or her to sell at a decent price. The market for minnows will be much more free at a lower price. True new investors will be looking at STEEM at a lower price not just the same people trying to buy low and sell high to infinity.
Not financial advice

IF you own any STEEM longterm holder or daytrader, You should be able to read charts.
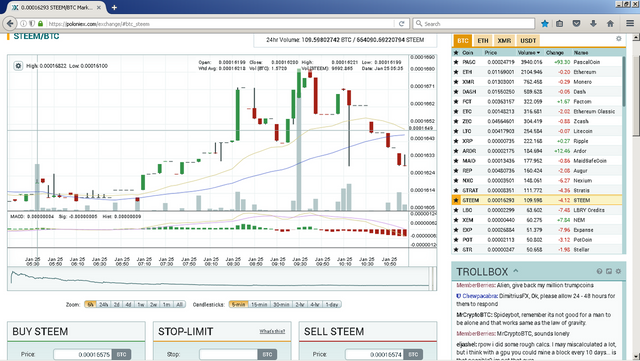
I have a feeling most of you have no idea what you are looking at so let me explain. Each of those main bars is 5min, the grey underneath them represents total volume and dark lines on the tops and bottoms of the main bars signify outlying volume, small amounts of coins traded at the very top or bottom of a single 5min bar's price range which is represented by the length of the main green or red bar plus the "hammer" which is what we call those black lines. The bars are green if the buys outweighed the sells and red if the sells outweighed the buys but they do not tell you by how much.
The very bottom shows more colored bars. These represent overall sell or buy pressure. When these are green and large the volume was overwhelmingly buys. When these are red and small the volume was slightly bearish.
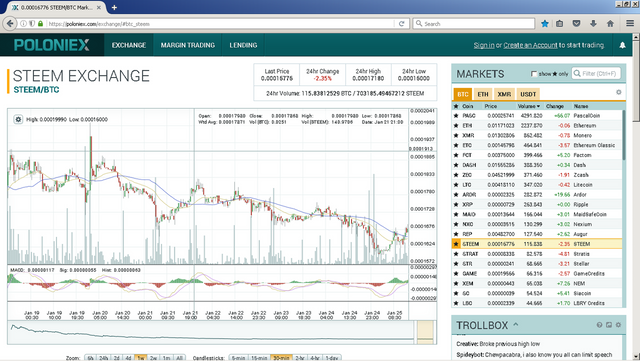
Below is a 1 week chart and each of these bars is 30 minutes
Dumps like these may help make single digits a reality
For when Bernie flags this


From my analysis I have speculated a slow increase of STEEM value over the next 16 months, with a sharp rise when the upward trend is noticed by more. A lot of this will come from increased members to Steemit, and new blockchain derivatives connected to Steem. Steem is a bomb waiting to explode, and unlike the last explosion this one will be brought upon by sustainable growth.
Where on the chart are new users listed lol
Sorry I meant from my own personal analysis and research. Here is an interesting article from Forbes which touches upon upcoming features and growth.
Yes, I can feel the growth enlarging ;0 I really can! I can feel and see more users, articles are getting more creative. STEEM is ready to blow! I just hope it goes down close to .02cents like@matrixdweller says, before heading up so I can pick up a boat load as well ;)
I doubt it at this point, but who knows... would be cash.
u think we will see it go that low? ill be surprised to see it below 10
I agree with @doitvoluntarily if we were going to see below 10 cents we would have already.
If it goes below 10 I think it will HAVE to go that low
Interesting post. Peace
Nice post! just want to comment on why Poloniex charts are a bit difficult to read - 1wk should represent 1wk candles not 1wk 30min candles? lol
bottom left is zoom category that is where you choose chart time frame. Bottom right you have candlestick options where you choose the candle stick time frames.
Exactly, confusing to the new ones coming in learning charts ;)
I wish !
@berniesanders will crash the price of Steem