Technical analysis of steem.
The picture below shows the Steem price over the last year:
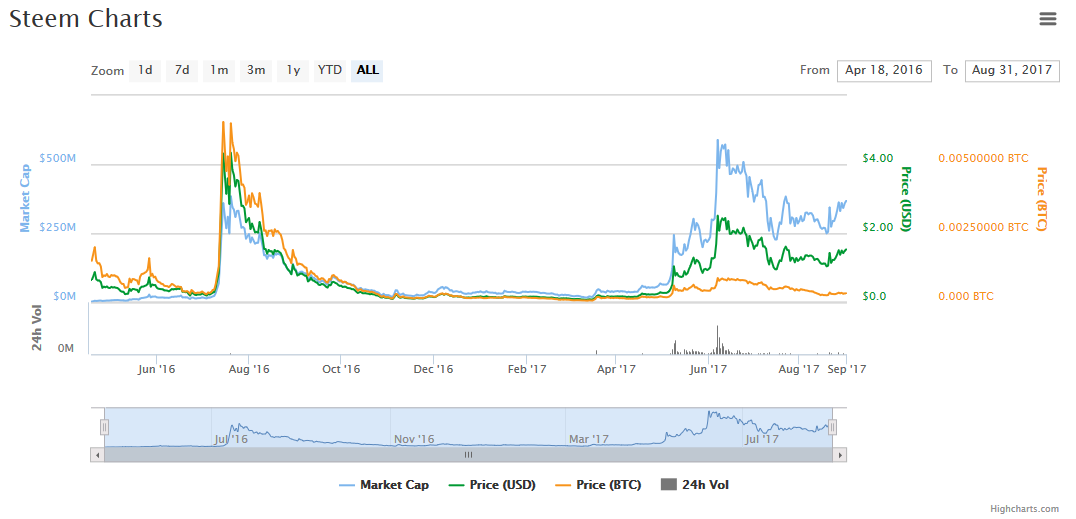
In the beginning the price was generally in a downtrend until around aug '16, after that you can divide the chart into 3 major area's (see pic below).
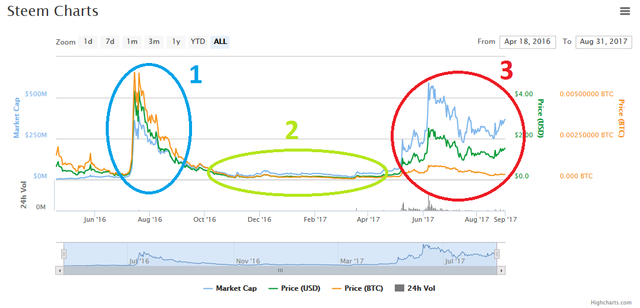
AREA 1/ After the downtrend in the beginning the price skyrocketed to $4.
This move can be the result of a lot of things (adoption by big exchange, fork, news, rumor, regularization, ...), but like most coins in the cryptocurrency world it is mostly hype. But for technical analysis it is not important to now the cause of the move but try to predict what will happen to the price after such an event and try to be in there the next big move up.
Because most of the time the spikes are mostly hyped events, the most coins will go down to the former price, so don't try to chase it to much after such an event especially if it is the first spike for that specific coin.
After move 1 (in the pic) most coins will disappear, or go into the fridge for a long time like Steem (move 2 on the chart).
AREA 2/ Steem went back to his former price for a long time. But in may this year there was an significant increase in price.
AREA 3/ Steem spiked for the 2de time and reached $2. This is a very good sign because this coin already survived the 1ste spike and crash in '16 (AREA 1 in pic). Meaning this is becoming more and more interesting to invest in, not only for the short turn but also for the longer turn.
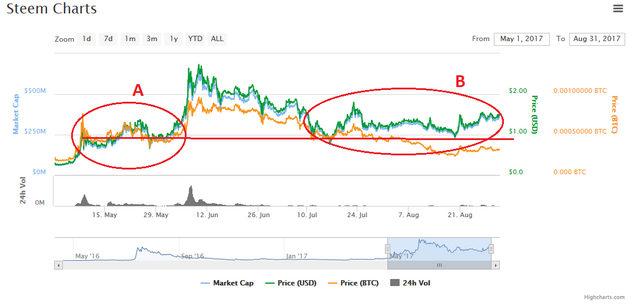
So zooming into the previous 2months (AREA 3):
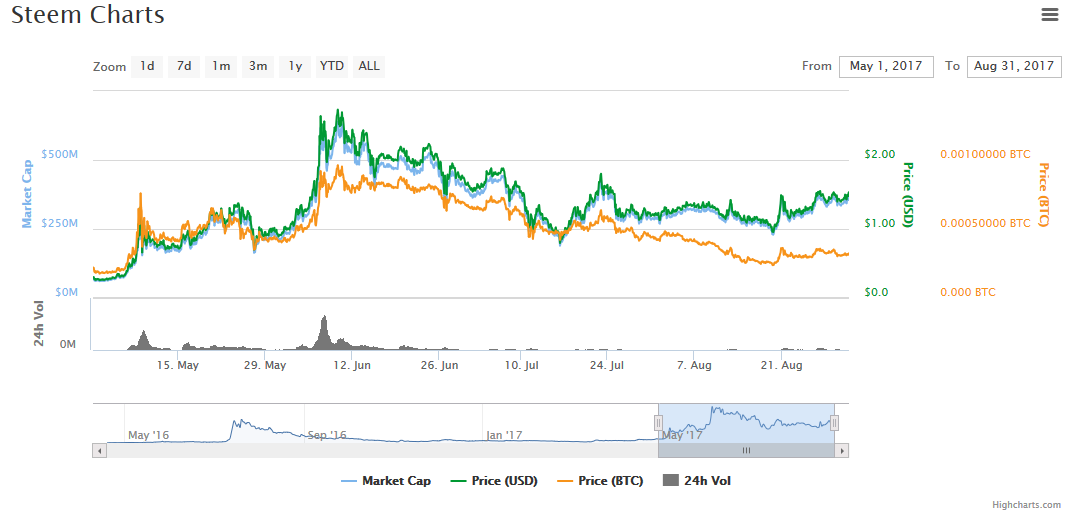
Price moved up and moved back down (but didn't reached former all time high of $4), but the important thing is that the price didn't returned to his former price!
The price found resistance on former price action (area B bounce on area A, pic below), strong sign.
After the bounce the price is staying "neutral" for a few weeks now and has formed a new bottom (19 aug) above the previous bottom (16 juli +-$1).
If you draw a trendline from the High (H) touching the lower highs, you get tradable breakouts. If you wanna have stronger signals you must wait on the pullback on this trendline.
See pic below:
The fist breakout (nr 1) you could have made a short turn profit by setting a strict stop. If you waited for a stronger sign (the pullback) you never entered the trade as you can see on the chart (nr2), the price failed to bounce of the trendline.
But on the 2de red trendline (with nr 3 and 4) the price did bounce (pullback nr4), this was a good buy signal.
The next buy opportunity is maybe happening in the next hours or days (nr5 on the chart), if the price crosses the horizontal (orange) trendline on the chart.
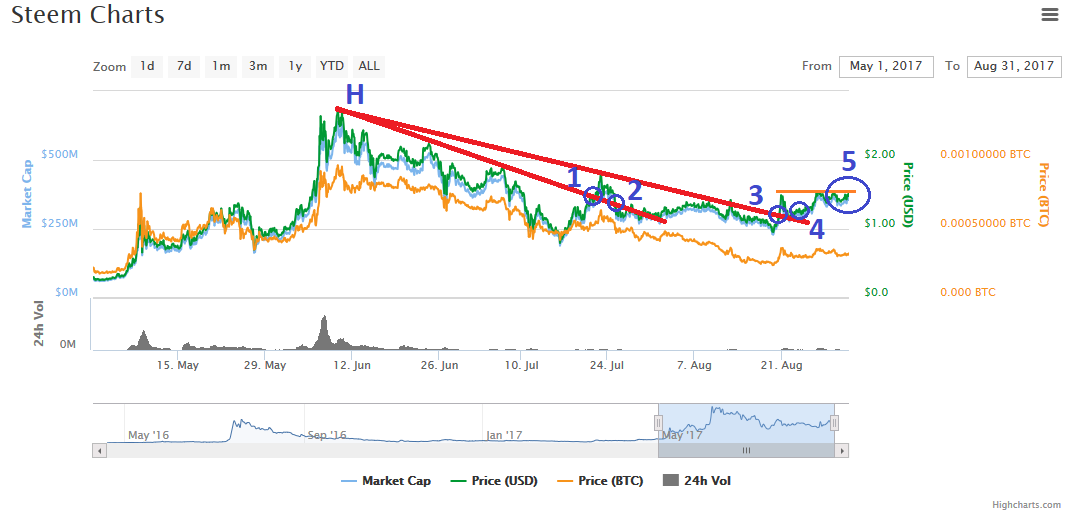
Price target depends on style of trading, but the H on the chart is one of the easiest targets to spot.
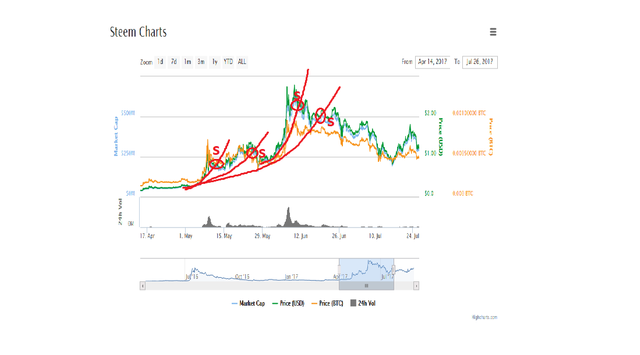
Because crypto's are very explosive stocks, one of my strategies is to draw an hyperbola and sell (around 30-50% or even 100% of my investment) when the price crosses this line and buy it back at a lower price when technical analysis give me a next buy signal. In case the price moves back above the high (immediately after crossing the hyperbola), then most of the time i buy back my 30-50%.
Example (fast drawn, so not accurate):