STEEM - Managing Risk With Lines Of Force
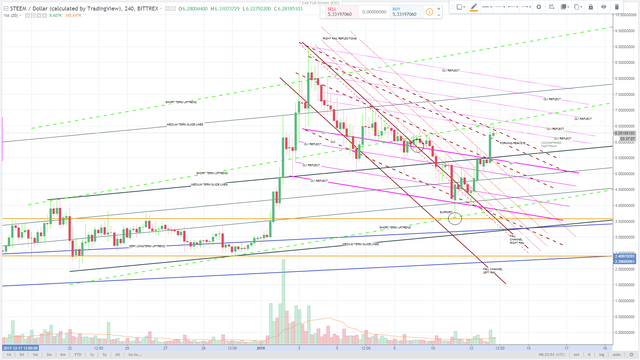
Lines Of Force models are used to estimate Risk. Shown is a fully annotated model of STEEM on 13 January. We'll look at it and compare it to the same model from 16 Jan to see if and how it might've helped mitigate risk.
 STEEM 13Jan - Annotated Model, click for ginormous image
The Obvious And Familiar
You know what a trendline is, and you know what a trading channel is, so that much at least is obvious. STEEM had been trading in a range shown between the Gold parallel lines. Over the course of the life of STEEM, it's developed an ever-so-slight bias to the upside, shown using Dark Blue. These are the only two sets of forces not labeled.
The Medium Term Guidelines show a gentle and persistent force to increase the uptrend on the bias noted above. This force is becoming/has become a general uptrend which should replace the original bias as a Very Longterm Force.
The Short Term Uptrend is shown in dashed Green. It has not been completely confirmed and so must be considered a probable force. There are several confirmations of the force along the upper Short Term line. But until a low returns to touch and rebound from the Short Term baseline, we cannot consider it confirmed.
The Fall Channel And Control Line
The Fall Channel is the area between the two Deep Red lines. This Fall Channel was drawn using the standard method. From the peak, the right rail was drawn through the next lower peak. The left rail was cloned from the first and placed along the low of the first reversal period after the main drop from the peak.
The Control Line CL1 was drawn from the last low before the peak thrust, through the first wick crossing the Left Rail of the Fall Channel at the point of intersection.
The Control Line CL2 was drawn through the Low on the same candle. Everything about this model is standard LOF.
While much of the action inside the Fall Channel is directed by CL1, the final control of Price near the Fall Channel on this model is handled by CL2. This is not so on every model; sometimes CL1 handles it all. The determination of which is the stronger is made based on the support Price finds.
Here Price is guided to support at the Upper Trading (Gold) line by CL2. As Price finally left the Fall Channel a possible Fast Track was indentified, and waits for confirmation. No new trend was confirmed at this point.
CL1 Reflections
Any particularly strong CL1 will have strong reflections of the force nearby. It's always a good idea to show their probable locations, which are almost always found by cloning CL1 and placing each clone against the Lows from each preceding rise prior to the peak.
Notice how each lower reflection tries to meet Price as it flirts with the Right Rail of the Fall Channel. We can never use reflections to predict price action, but in an extended fall they can indicate that price may find its way there.
Also note that while the Control Line's purpose is to guide Price to a support, the Control Line itself may act as a support as well. Lines plotted on an LOF model are areas of turbulence between two forces. They can act as support or resistance.
CL2 Reflections
In contrast to the CL1 Reflections, all CL2 Reflections are drawn above the Fall Channel. All strong Control Lines will have strong reflections. They are almost always seen emanating from the peak, the peak-before-the-peak, and the post-peak peak. I always expect the pair created by the peak and post-peak to become very strong.
The Eye
When found close together, two Control Lines (or their reflections) can create an Eye. This is an intensely turbulent area which has the ability to sometimes completely derail an uptrend. While a Control Line tries to lead Price to support, an Eye tries to take Price below its support and destroy the uptrend.
Days Go By
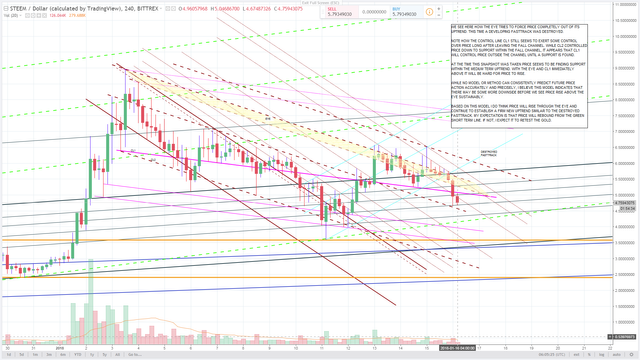
Let's look at the same model as it appears on 16 Jan. I've removed most annotations and added a brief analysis on the model itself for clarity. The results seen here are pretty standard for the LOF method.
 STEEM 16Jan - With Notes, click for ginormous image
Lines Of Force models are all about examining risk. It doesn't predict (much) but it does indicate. Using this method it's possible to prepare for what might happen to Price in any circumstance.
Nothing can be predicted with certainty; all we know is up to the Now. Price is just a thing and like all other things, it is subject to the forces imposed on it. It will always follow its path of least resistance. Once we realize this it becomes paramount for us to find those forces.
UPDATE
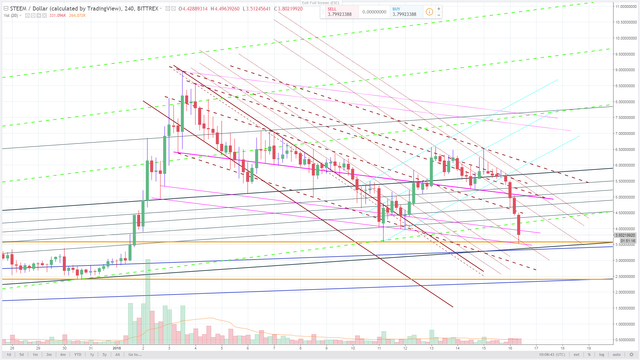
Roughly three hours after this post was published we see Price nose-dive pretty much the way our model indicated it might. Note that Price did not stop at the Golden Line. Instead it found support on a CL1 reflection--we could expect even more downside from here. There is a chance that it will rise here, however, as Price has just tested an established trading base area. You make your bets, you play your hands. Best of luck to you.

For more information on Lines Of Force read the FREE FOR NOW ebook Introduction To Lines Of Force - Modeling Post-Peak Price Behavior. All images by me.
Great chart! I need stronger glasses, though and would do well to enlarge and print it for reading and following along. Of course, I have advantage of sneak previews. :) Good job, Jon!
Very informative, did love to follow you so as to see more of this kind of post from you.
What did you like the most? Was it the poetry? I do so love poetry!