Logarithmic STEEM Chart - a unique price perspective

Most analysts use regular charts to perform technical analysis. Although a logarithmic chart can give a completely different and unique perspective.
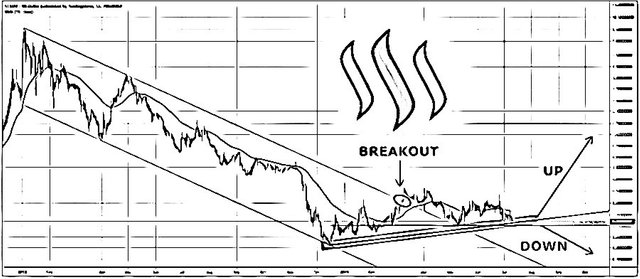
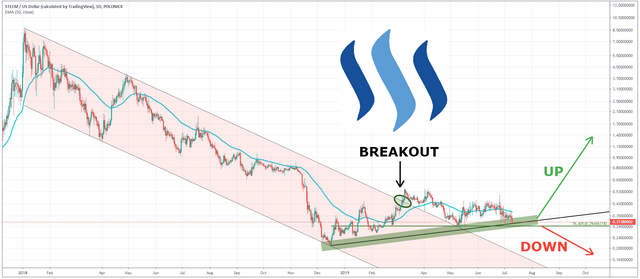
Looking at the STEEM vs USD logarithmic chart, it becomes obvious that price has already broke above the descending channel. It could have been the first sign of the trend reversal. The breakout occurred back on the March 7, although since then, price has consolidated between areas near $0.2 and$0.6.
Basically Steem value in USD has been going sideways for 6 months, but what is interesting is how it happened. As price produced higher highs and higher lows, the uptrend seems to be at the very early stages. At the same time, the utprend trendline is being rejected right now.
Whether this is a great buying opportunity, its for you to decide. Just keep in mind, that break and close below the Fibonacci support at $0.294, might extend the consolidation period. At the same time break below the $0.275.
Let me know what you think about the Steem direction in the coming weeks...

