Steem chart review, Oct 19th 20:00 pst
Here is the weekly chart of steem with a heikin ashi overlay on the candlesticks.
It's been all red over the last few months as Steem has dropped to the low produced in late 2017.
Stochastics have attempted to rise from an embedded/oversold zone.
Hopefully the support level will hold and price will continue to trade within a tight range before a breakout...

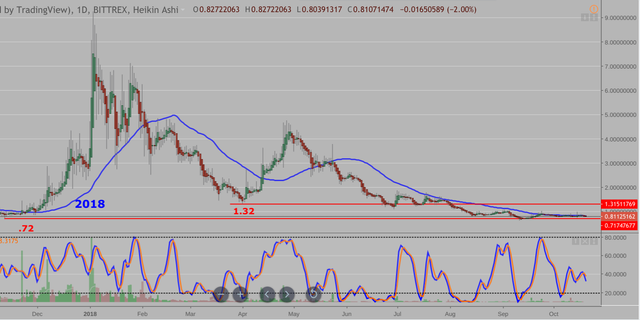
The daily chart shows the tight trading range that it has been in and the support level at ~.72
The 50 dma in blue may be applying upside resistance, there may not be many bids due to the lack of enthusiasm with BTC.
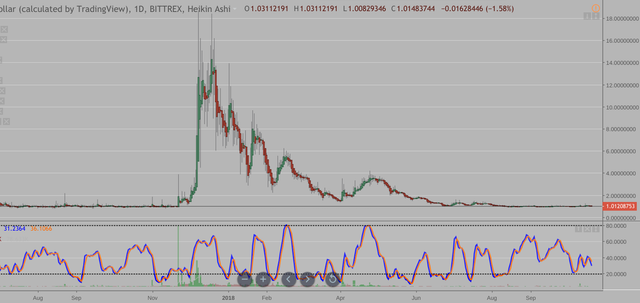
A chart of SBD's has been trading similar to the Steem price...
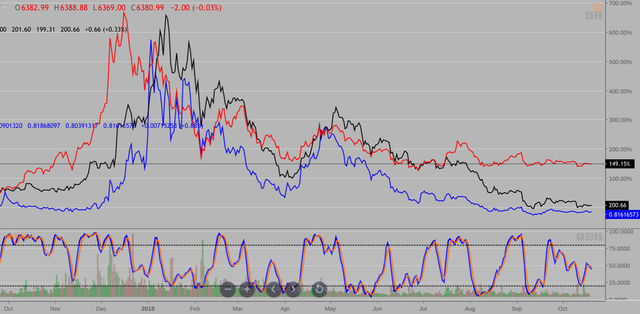
Here is a overlay of BTC in Red, ETH in Black and Steem in Blue.
Steem has dropped more on a percentage basis than both BTC or ETH. Guess that is what is expected of an 'alt' coin/token...
Nice analysis and it is shown graphically. It is good information for the steemians. Nice blog.
good information thanks