STEEM and SBD Chart Updates - Those Poor Triangles! 😭
Those Poor Triangles...
The triangle patterns that I have been posting about recently have had a tough time today, and they all seem to have broken in a way I wasn't expecting. 😞
But! There may be some good news in all of this.
I always say that I could be wrong, and this time I am, but I think I've learnt something too! which I'll explain below.
Let's have a look and try to see where I went wrong:
STEEM - Argh!
I was confident after my Litecoin prediction that this triangle:
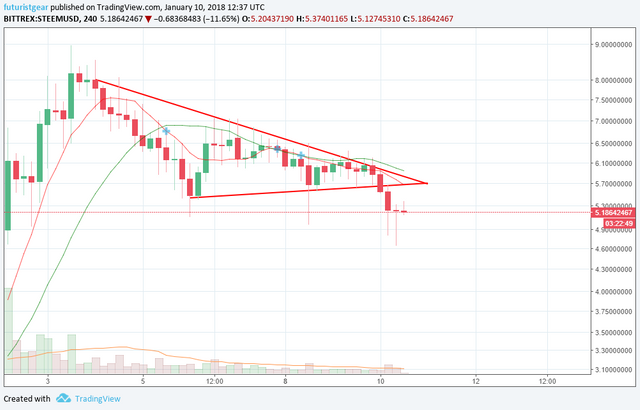
...Was also forming in a bullish manner, but obviously not.
It doesn't help when most of the crypto currency market decides to correct, but as I mentioned above, there may be some good news in this.
What Good News? The Price Is Tumbling!
Well, after looking at few of my other triangle patterns, it appears that I may have been trying to spot something that wasn't really there.
The trouble with technical analysis is that you can sometimes use it as a tool to confirm your biases.
If you're feeling bullish, will you not look for more bullish indicators? Rather than looking for signs of a bearish nature? I think that's what I have done here.
So with that in mind, what do I know now?
Correction #2 Isn't Over (Yet)
The good news is, I'm still pretty confident that this is the 4th wave we're experiencing now. Which means 2 things (if I'm right of course):
- STEEM prices shouldn't drop below $4, and
- We've still got the 5th wave higher to come.
I now think, that the corrective triangle looks something more like this:
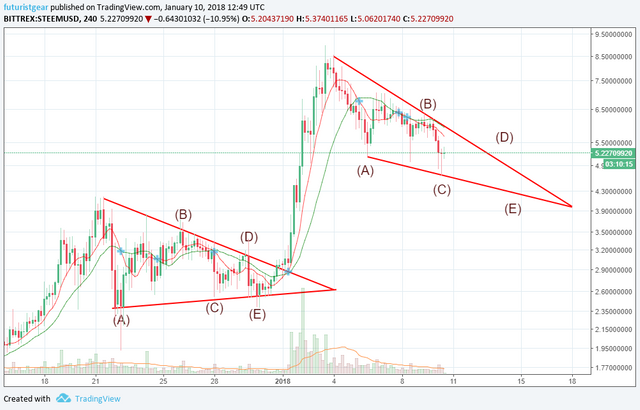
I think It makes sense that after such a big run up, the resulting correction would be steeper than the previous one (the triangle to the left, which I believe to be correction #1 or the 2nd wave).
STEEM Vs BTC
I didn't believe that this was a triangle formation on the STEEM/BTC pairing, and it seems I was right about that at least. 😉
As we can see here:
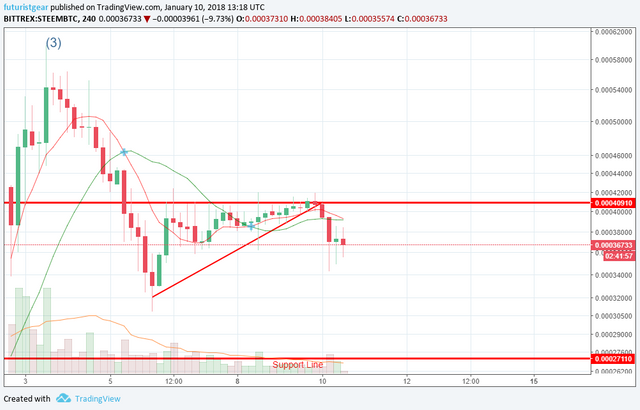
That resistance line has held, and we are even experiencing a drop of around 9% (+/-) against Bitcoin.
But if there is a triangle forming in the STEEM/BTC pair, I wonder if this could be it?
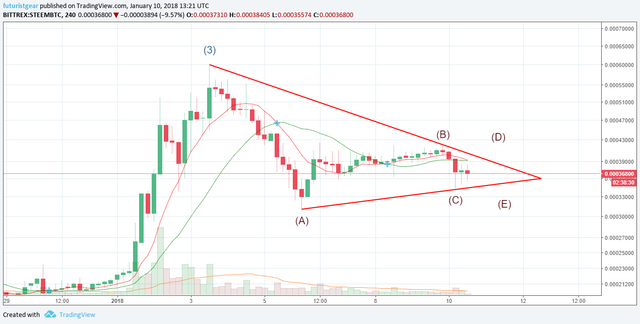
I certainly hope so, but we shall see! 😀
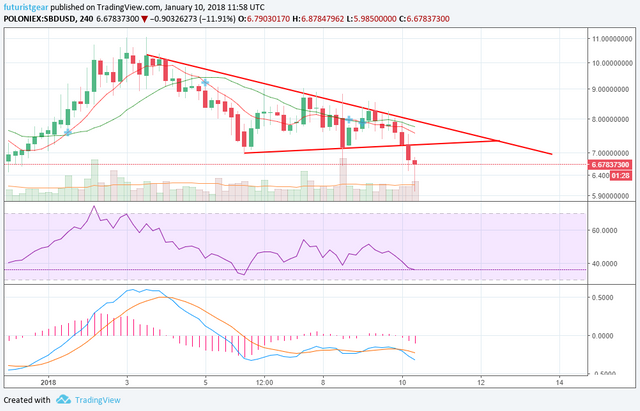
SBD Triangle Violated? YEP!
Steem Dollars have also followed STEEM, and my triangle pattern has been breached here too:
After comparing it to the previous one:
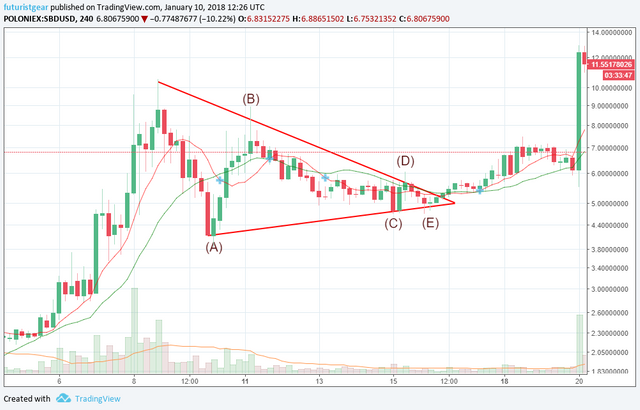
And hopefully learning from my mistakes, maybe it should actually look like this?
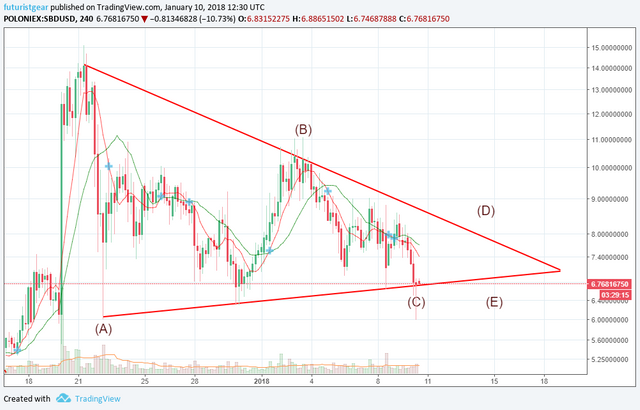
I hope so, because that would mean I now know how to draw triangles correctly, and it will also mean that, while I was trying to find a bullish triangle and failed in doing so, another one could still be forming despite the recent drop.
I'll be watching all these patterns to see if I've learned from my mistakes, and hopefully we will see the upward moves for both STEEM and SBDs that I am both expecting and hoping for sometime soon.
Any thoughts or comments on the above? I'd love to here them!
Thanks for viewing.
For more awesome technical analysis and crypto related posts, see also: @toofasteddie, @gazur, @ew-and-patterns, @pawsdog, @cryptomagic, @exxodus, @beiker, @allthereisislove, @lordoftruth, @masterthematrix, @cryptoheads, @tombort, and @maarnio
Not investment, financial, or trading advice & purely for entertainment purposes.