$STEEM/BTC : Not Revisiting the Highs This Year, if Ever (Technical Analysis, Bittrex, August 15)
How it going Steembros? This is my technical analysis for Steem/BTC. I used a daily chart on Bittrex because it has the most historical data. I take a look at this pair from several angles to arrive at my hypothesis for this year (not revisiting the highs).
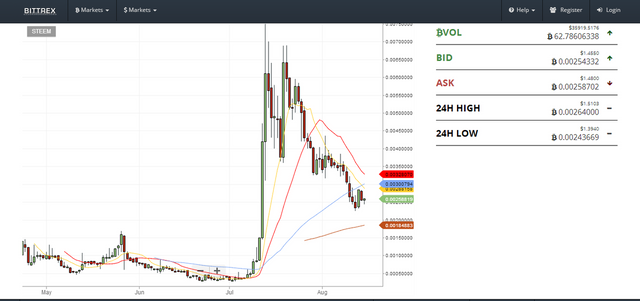
First let's take a look at the trend. The first chart below shows several simple moving averages, 10 Day (yellow), 20 Day (red), 50 Day (blue) and 100 Day (brown). I tried to get the 200 Day in there too but alas there was not enough data for it to show up. Hopefully we get to see it in my futures updates. We are currently trading at 0.002588, below three of the four moving averages noted above. We are in a clear bearish trend in the short to medium term.

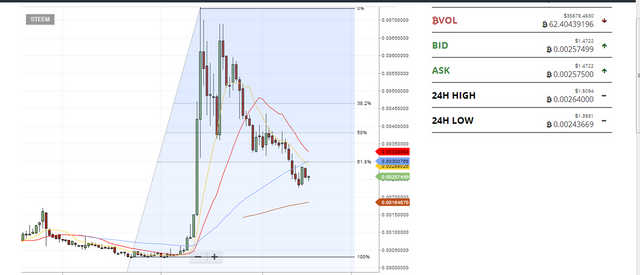
Our next chart shows an even stronger bearish signal. We're now trading below the 61% Fib retracement measured from the all-time low to the all-time high. This is a major decline from the 0.0075 highs seen on July 13th. But it's not just the magnitude of the move that matters, it's the speed too. It only took around one month for Steem to lose over 61% of its value. This is significant as it shows a classic chart of bubble gone bust.

After bubbles burst there is a long period of consolidation with erratic price movement. It is highly unlikely that we're going to see STEEM resume its upward trajectory anytime soon after such a sharp fall.
Basic market psychology is at play here. The quick decline likely caught many by surprise. Plenty of people stayed on the sidelines waiting for a bounce that never materialized. Now imagine if we start trading higher. These traders will start to dump the coins they're holding. The higher we go, the more the selling will intensify as we approach the breakeven point for more and more HODLers, who will dump into the rise.
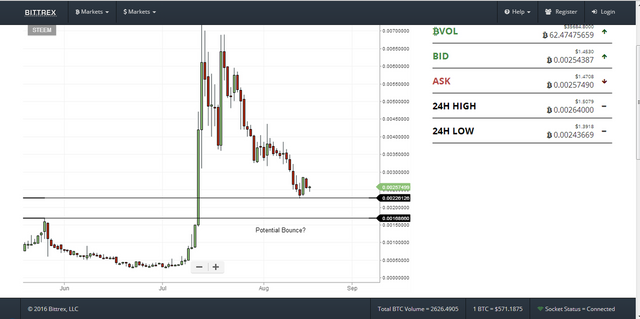
So would I go short here then? Not so fast! We've already fallen a substantial amount. Dead cat bounces in crypto can be brutal, as many of learned this year trying to short Ether. But the third chart below shows a possible short-term trade idea. The 0.00168 highs is the breakout point for the current bubble. A revisit near this level will likely be met with some buying pressure, at least in the short-term. A bounce here may take us back to around the second line you see on the chart below, the 0.00226 level (this month's low).

The usual disclaimer applies, these are just my thoughts and not trading recommendations. If you lose or gain money that's on you, not me :)
Let me know if you have any questions. Please follow me here https://steemit.com/@forextrader
I plan to post regular analysis on STEEM, BTC, ETH and maybe LTC. If there's some interest I could go over some forex charts as well.
Muy bueno el material que publicaste, gracias por compartirlo. si queres podes visitar mi blogg y votar gracias