Steem Technical Analysis 16 September 2018.
Dear followers, in the previous posts I just write technical analysis on Bitcoin and Ripple. One of my friend @gungunkrishu ask for steem analysis. So specially for gungunkrishu and for all steemit community Technical analysis on steem is present.

Dear friends, look at the chart. One good news is steem is not currently in strong downtrend. So all steemit community should not worry about it.
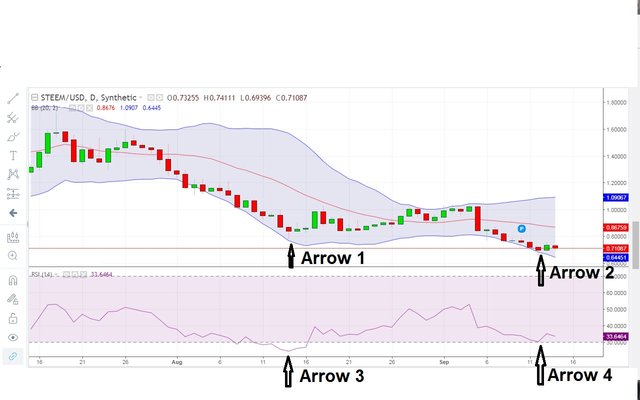
Look at Arrow 1 when last time price was near at Arrow 1. At that time Relative strength index indicator was at below 30 ( look at Arrow 3) which was indicating that steem coin is in downtrend. It means price will not reverse from this point. So same thing happened. Price goes up and then turned down again.
Now look at Arrow 2 when price reach at the point of Arrow 2, now keep an eye on the Arrow 1 it is the same price. But at this time Relative Strength index did not cross below 30. You can check Relative Strength index indicator at Arrow 4. It just touches the 30 line and turned back. It is the indication that Price is not in downtrend which is the good news for all steemit community.
Now main question is What will happen next.
Dear followers sorry to say that price did not show Reversal Pattern here. So in the next many days price will not bounce back sharply.
Second option from here is price will change itself from downtrend to sidewave trend. So wait for the sidewave trend then I will be update you again.
Follow me @cryptoexpert79 for more technical analysis of cryptocurrencies and much more.
https://steemit.com/cryptocurrency/@cryptoexpert79/ripple-analysis-best-time-to-buy-hurry-up
https://steemit.com/cryptocurrency/@cryptoexpert79/bitcoin-analysis-5-september-2018
thank you sir. first off a big thanks for considering my request and providing your analysis on steem coin. The, analysis looks great, I did try understanding the technical terms but some terms were hard to understand like relative strength index indicator. Although, am positive on what you said and hope the best for the Steem coin in-itself, coz. of the platform and various use cases which are already in use by majority of the people and many of them benefiting from it. Once, again many thanks for considering my request on providing the technical analysis for the STEEM coin.
Hi @gungunkrishu, you are always welcome, Relative strength index is the abbreviation of RSI, it is the indicator which is present in different platforms. It has value between 0 to 100. For many decades it is considered that when RSI approaches to 30 then market will return to up and when RSI reaches to 70 market will starts towards down. But it is true only in case when market is in sidewave trend.
You got a 7.88% upvote from @upmewhale courtesy of @cryptoexpert79!
Earn 100% earning payout by delegating SP to @upmewhale. Visit http://www.upmewhale.com for details!
I'm hoping one day I will author better posts. wish me luck!
Hi @classicmemes, consistency is the major part of the success in any field of life. If you show consistency here in steemit then definitely you will author better posts. You should also concentrate on getting votes. I have seen here even some bad posts get upvotes. So keep it up. I hope you successful journey here.
we see the spike today. your analysis on STEEM was true. seeing an upward trend for STEEM and others have fallen. so this would be called a sidewave trend followed by upward trend. Is that correct to assume based on your analysis?
Hi @gungunkrishu, sidewave trend means price sets high and low then price touch high and low many times. Then price breaks either upward or downward. So it is expected for steem that downtrend is over and after sidewave trend price of steem will break upwards then upward trend will be started.