Jan 19 2018: STEEM may be a hold, not a sell as of today…
STEEM may be a hold, not a sell as of today…Please let me know what you think!
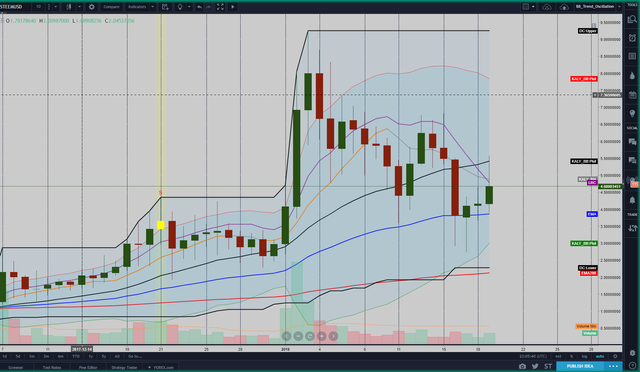
The Screenshot of 1 day STEEMUSD(bittrex) :

Here the price for the day
1.is hanging on both 20 period regression line and 20MA.…
2.BB(Bollinger bands) do not show a buy signal here yet…(not much squeeze).
3.However, it appears to have strong support for now on 50EMA…
4.From point (3) above, I think the daily candles starting Jan 16 2018(long Red candle) may be forming falling step method Candle Pattern (Bearish 3-Method(step method) Formation, Ref: https://en.wikipedia.org/wiki/Candlestick_pattern)
5.However, I see that 20MA, 50EMA, 200EMA are still bullish on this
6.Momentum waning on MACD, RSI
7.No trend on ADX10 periods
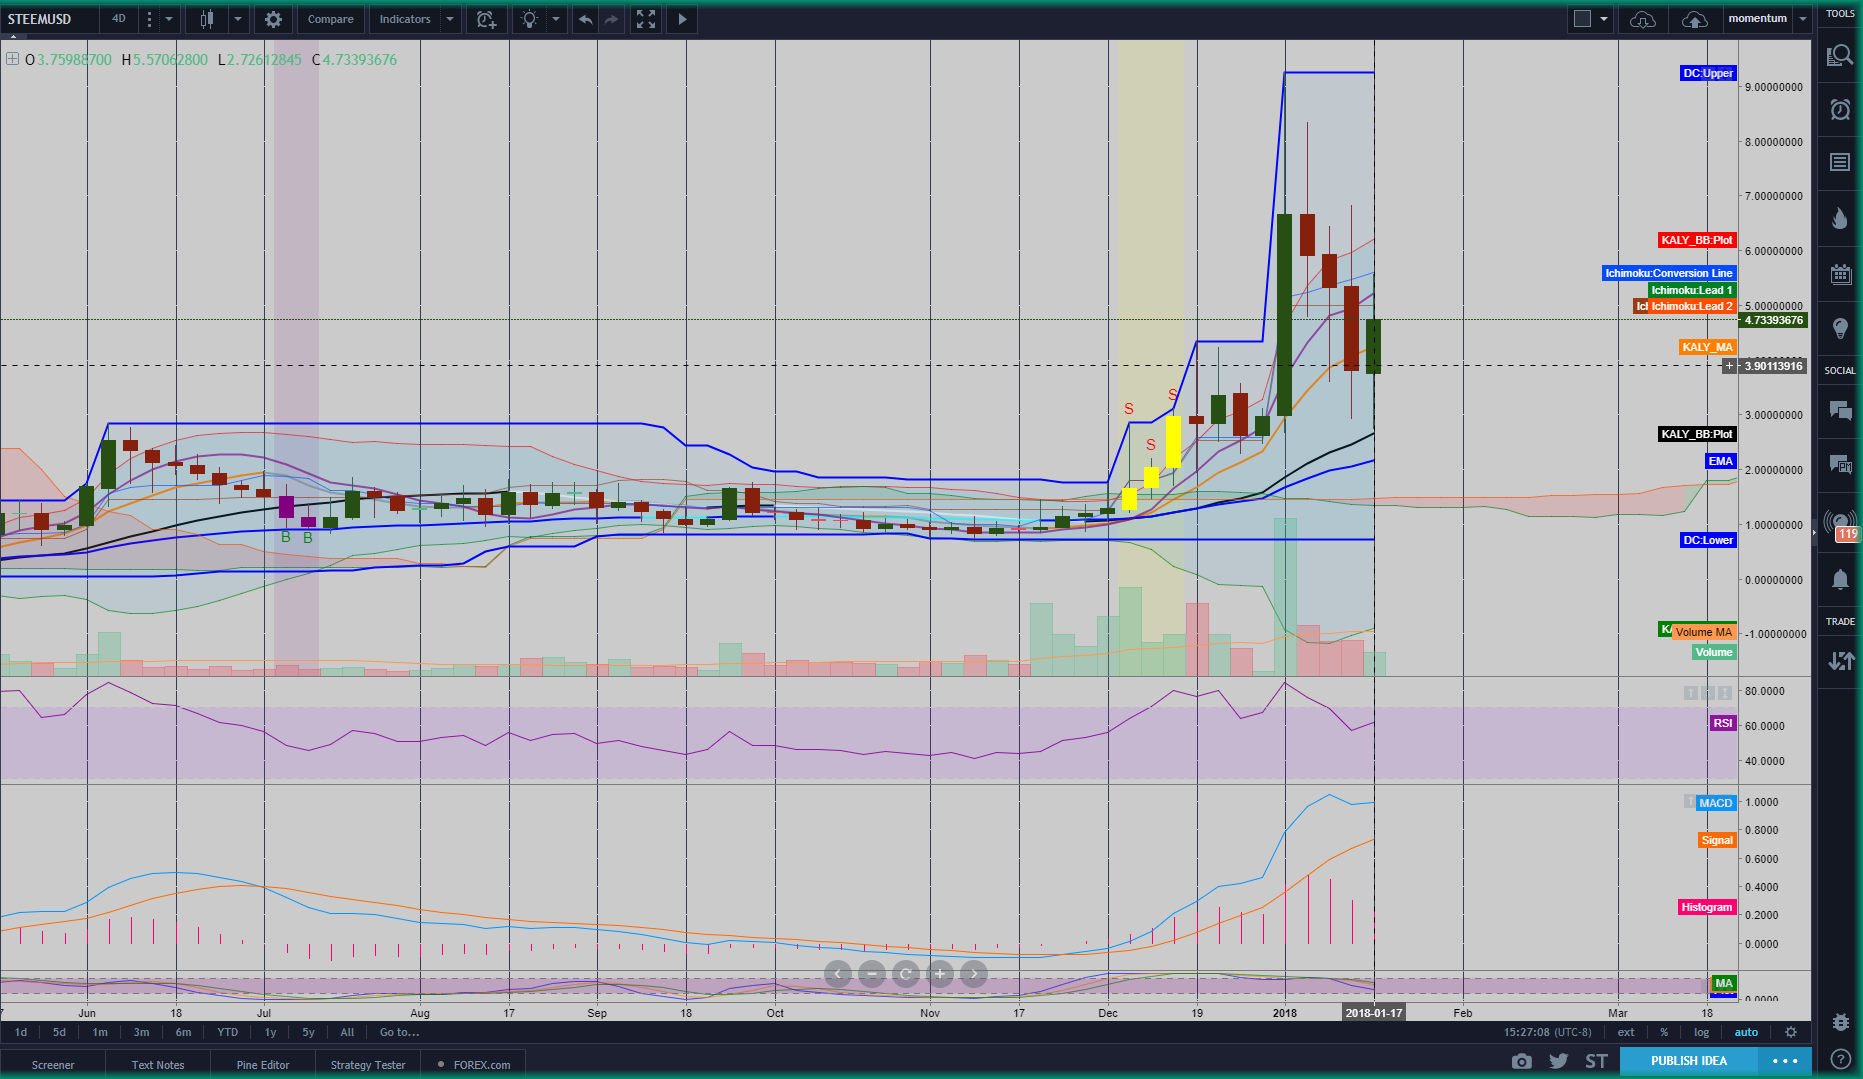
The Screenshot of 4 day STEEMUSD(bittrex) :

1.The chart moving averages show candles holding and trying to bounce back
2.RSI dipped and trying to float again above 70
3.MACD is bullish
4.Volume Indicators like CMF, OBV and UO appear to be sideways...
Therefore, I think STEEM may be a hold, not a sell as of today…Please let me know what you think!
Legal Disclaimer: I am not bribed to write here and I am not seeking to get insider favors. I wrote here so I get replies from fellow viewers to educate myself and for my daily expenses. Hence, if anyone uses this post for making their decisions, I am not responsible for any failures incurred.
Safe Trading!
Kal Gandikota
If you found this blog post interesting and edifying please follow, upvote, resteem.
SteemID - chipmaker
BTS Wallet - chip-maker
ETH Wallet - 0x0450DCB7d4084c6cc6967584263cF6fBebA761D1
NEO Wallet - AUdiNJDW7boeUyYYNhX86p2T8eWwuELSGr
