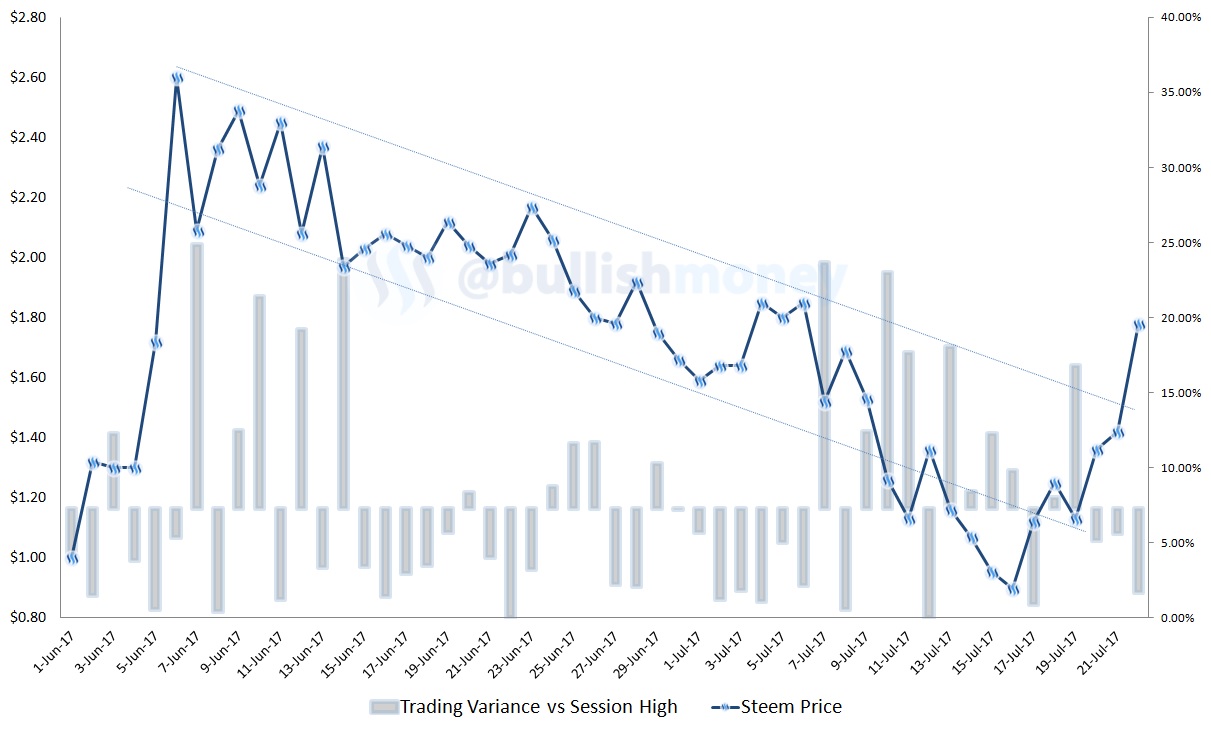
Technical Charts Indicates the STEEM Show is Back On!
I finally have amazing news for those long the STEEM cryptocurrency: with today's massive price swing, the STEEM rally is back on!
First, the Steemit coin has decisively broken past a declining trend channel:

Second, negative sentiment has been flushed out and the strong hands are moving back in over the past three days.
Third, I'm out...have a nice weekend!
Good News, thanks! it's always a good time to buy Steem.

It's back! :)
Good news :) Enjoy the rest of the weekend!
Sweet!
Have a nice weekend too! :) Thank you for the analysis , short but on point!
I don't even give a shit anymore! I'm just going to post "words" and a picture, and bye-bye!
What is the app this chart comes from? Looks like i have never seen anything like this. Would like to try it.
I'm glad you like it! Unfortunately, it's not an app...I manually created this chart.
I think this is probably the biggest danger in crypto right now!
https://steemit.com/cryptocurrency/@cryptocoinclub/blockfolio-addiction-help-group
Good call @bullishmoney.
Plus a pretty little head and shoulders bottom. It's looking real nice to me. Let's go get it.
Yes, that's definitely a convincing technical breakout.👌