Trade Recommendation: STEEM

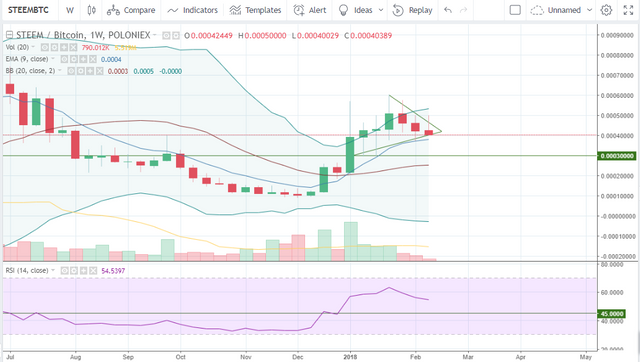
The STEEM/Bitcoin market ignited its uptrend on January 2, 2018 when it took out resistance of 0.0003. The momentum of the breakout was so strong that it pushed the pair to as high as 0.00060359 on January 25. In a little over three weeks, the market increased by more than 100%. With so much growth in so little time, breakout buyers took profits.
Faced with heavy selling pressure, STEEM/Bitcoin went as low as 0.00036992 on February 6. While it did bounce on February 14, it did not go above 0.0005. Since then, the market has been in decline as the daily trading range narrowed.
Technical analysis reveal that the market is creating a bullish continuation pattern in the weekly chart that’s close to breaking out. Volume has been below average since the market broke out of 0.0003 resistance. This suggests that those who bought the breakout are losing interest to sell. In addition, Bollinger bands in both the daily and weekly charts are starting to contract. This means that ask and bid prices are bound to meet soon, and when they do, the price will most likely explode up.
The strategy is to buy as close to 0.0004 support as possible. Once consolidation is over, the market will likely move to our target at major resistance of 0.0008. The process can take a month.
Daily Chart of STEEM/Bitcoin on Poloniex

As of this writing, the STEEM/Bitcoin pair is trading at 0.00040474 on Poloniex.
Disclaimer: The writer owns bitcoin, Ethereum and other cryptocurrencies. He holds investment positions in the coins, but does not engage in short-term or day-trading.
Follow Blockchain-Group on Steemit.com !
-> https://steemit.com/@blockchain-group

HODL is life!