Steem Stats: Total vs Active Accounts
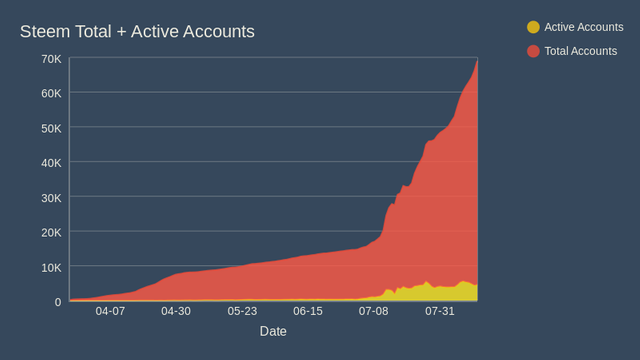
We all know Steem user base grows fast, so isn’t it interesting to learn the growth patterns? To that end, I’ve compiled some day-by-day stats on the number of accounts, and put them on a chart. Just look at this (red area represents the total number of users):
Isn’t it impressive?
The turnover point occurred about a week after the July 4th payout when the inflow of new accounts exceeded 1,000 a day for the first time.
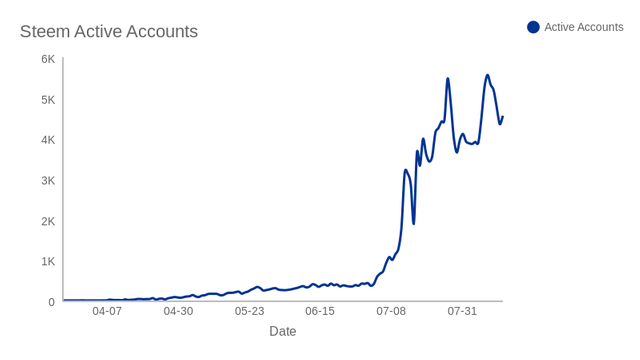
The yellow area on the chart is the number of “active” users per day, and by “active” I mean those who posted and/or voted on that day. I didn’t include mining, powering up/down, transfers and following people here. This is why my numbers are lower than those reported by steemd.com.
Here’s the enlarged active users chart:

And here are some curious facts I’ve learned in the process:
- By end of day August 14th, a total of 64381 accounts were registered.
- The first curator ever was @steemit78 who upvoted this first post on March 30th.
- That same day, first non-miner account, @fabian, was created.
- As one might expect, there are more curators than authors. 21243 accounts (33%) posted at least once, while 29606 (46%) ever voted either up or down.
- 4506 accounts (7%) downvoted at least once. Interestingly, there were accounts that downvoted but never upvoted.
- 11847 accounts (18%) were involved in mining.
Let’s see what comes next. Will the curve start easing or will it become even steeper?
Oh, and if you are interested in other types of stats, please let me know and I'll see what I can do.
I've used the following software while working on this post:
- python-steem by @xeroc to parse data from blockchain
- Chartblocks for charting
Both are excellent products, couldn't have been satisfied more!

Disappointing active stats, to be honest.
Maybe... or maybe I don't know very well how to interpret them. If I could exclude accounts that are not supposed to be active (miners, pure investors, bots etc) from stats then we could see just how many people actually give up Steem. But it's not easy to do
I want to thank you for putting this data and presentation to the steemit community together. The data is what it is.
After 7 July the activity certainly does suggest that the new steemians are more active than the original steemians. I interpret that as good for now. The question would be does it last.
An interesting graph would be the percentage of total steemians active each day. If the percentage is flat lining or turning down then that would be bad. I suspect it is on the upswing, but the data will tell.
Again, thank you for your efforts in putting this post together.
Steem on,
Mike
I agree; I'd just wait for another month maybe to see trends established. Currently as one can see the number of active users fluctuates wildly from 4k to 5.5k and back - this is some 30% difference.
wondering how it breaks down throughout the day
Ahh... a recent comment. I'm wondering how it looks today! And to your point -- throughout the day as well.