STEEM-flow monthly report #9
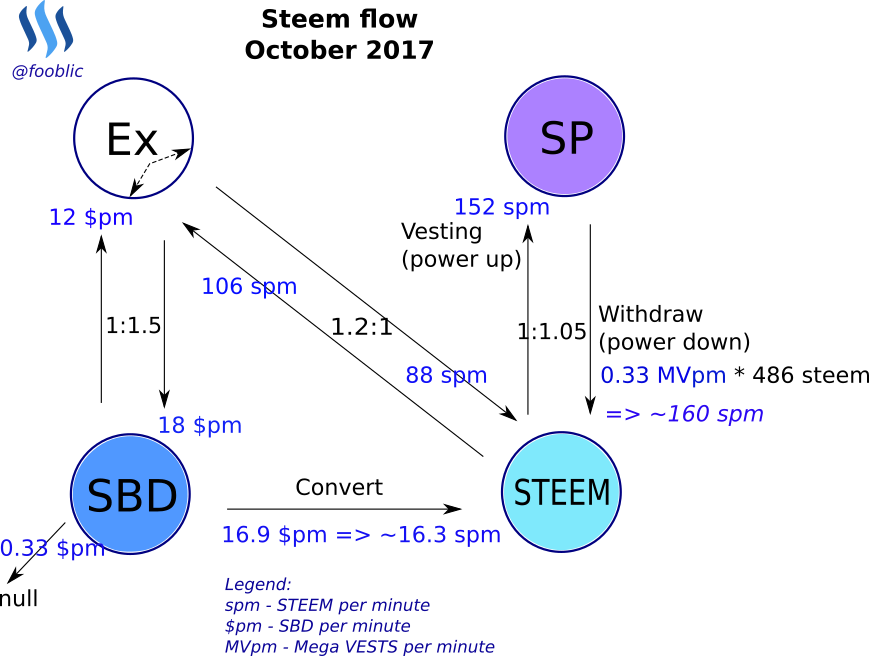
Average STEEM flow intensity in October:
Since my previous report two months ago: STEEM flow report #8 - no significant changes occurred. The STEEM price continue to go through slightly dropping tunnel from June peak (2.7 USD) to traded now price level less than 1 USD.
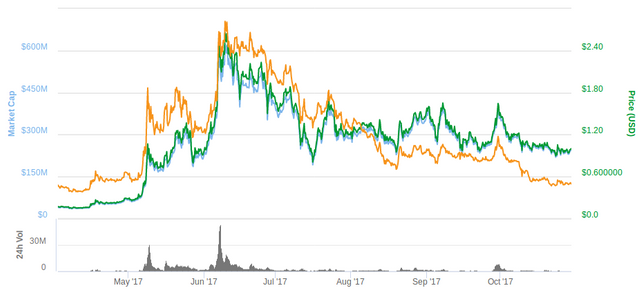
STEEM price chart
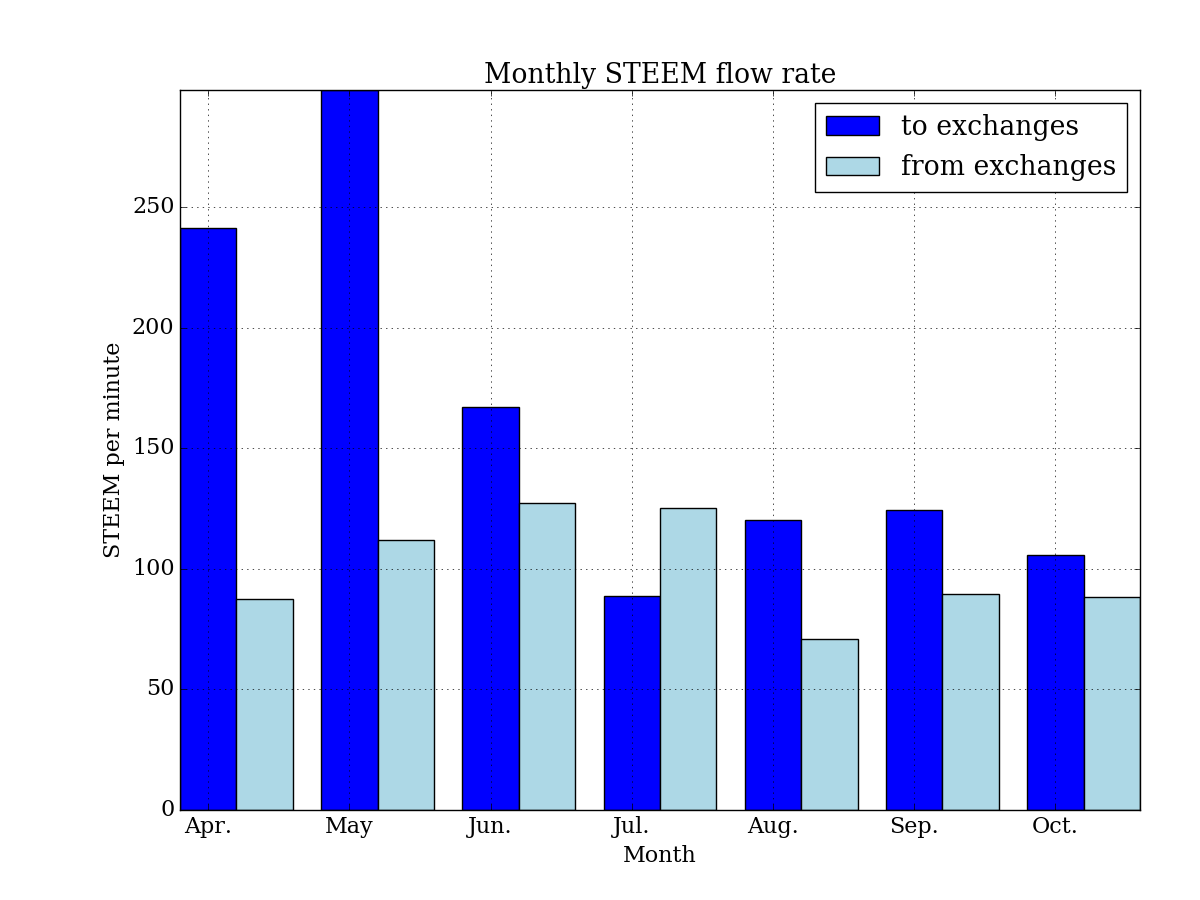
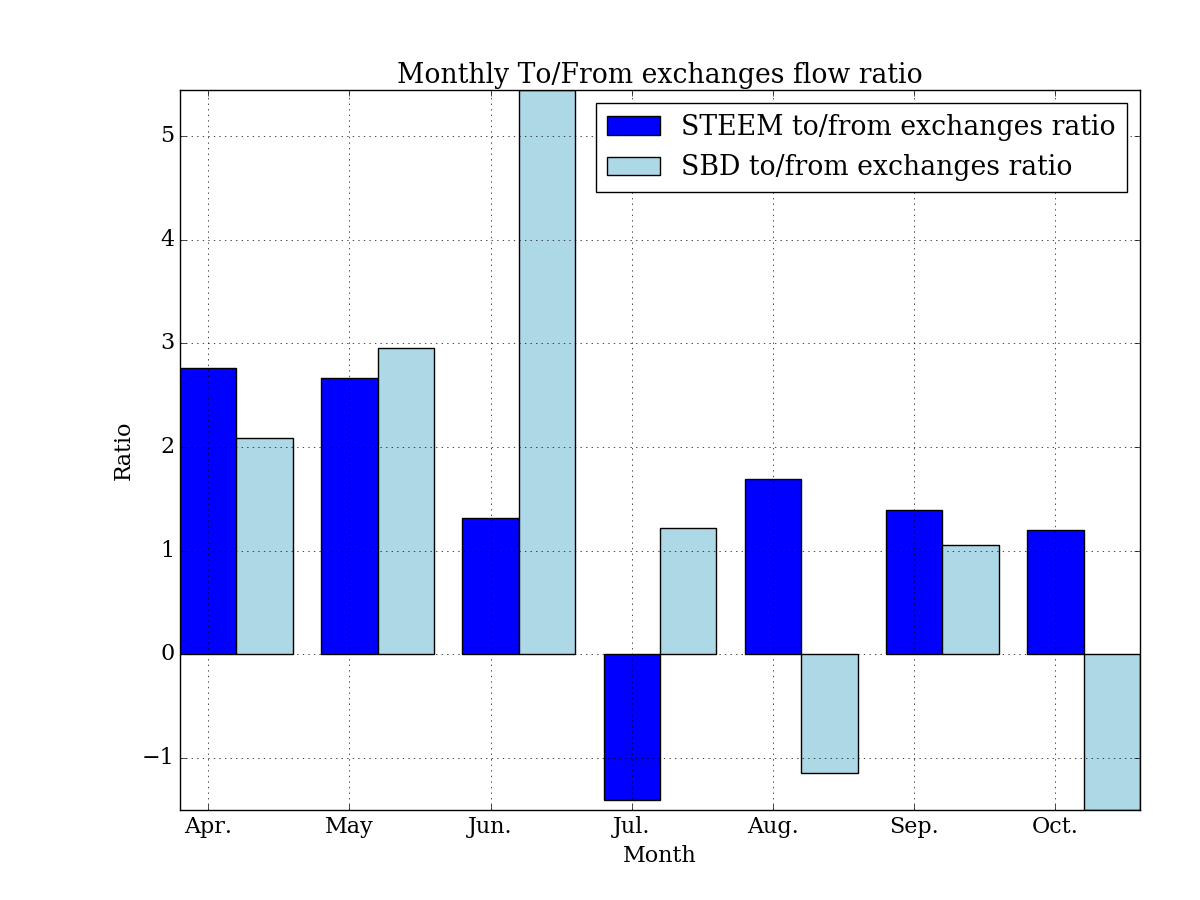
STEEM flows intensity are quite similar for 3 past months and become even.
Interesting that SBD flow mostly prevails in direction from exchanges to the system in October.
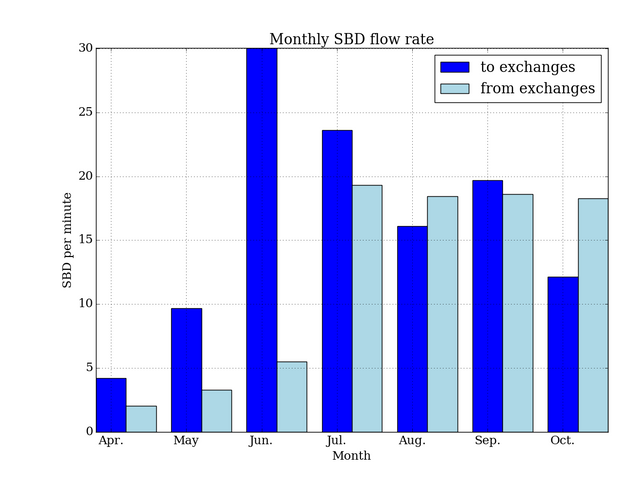
SBD flow from exchanges is more intensive than was in August.
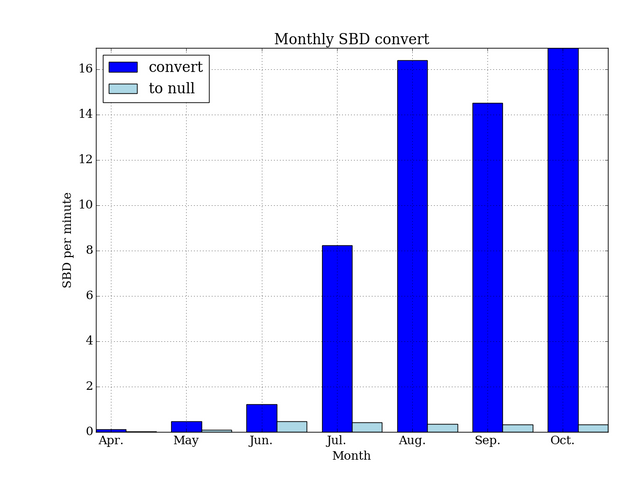
Conversion of SBD to STEEM in Steem blockchain keeping intensity for last 3 moths.
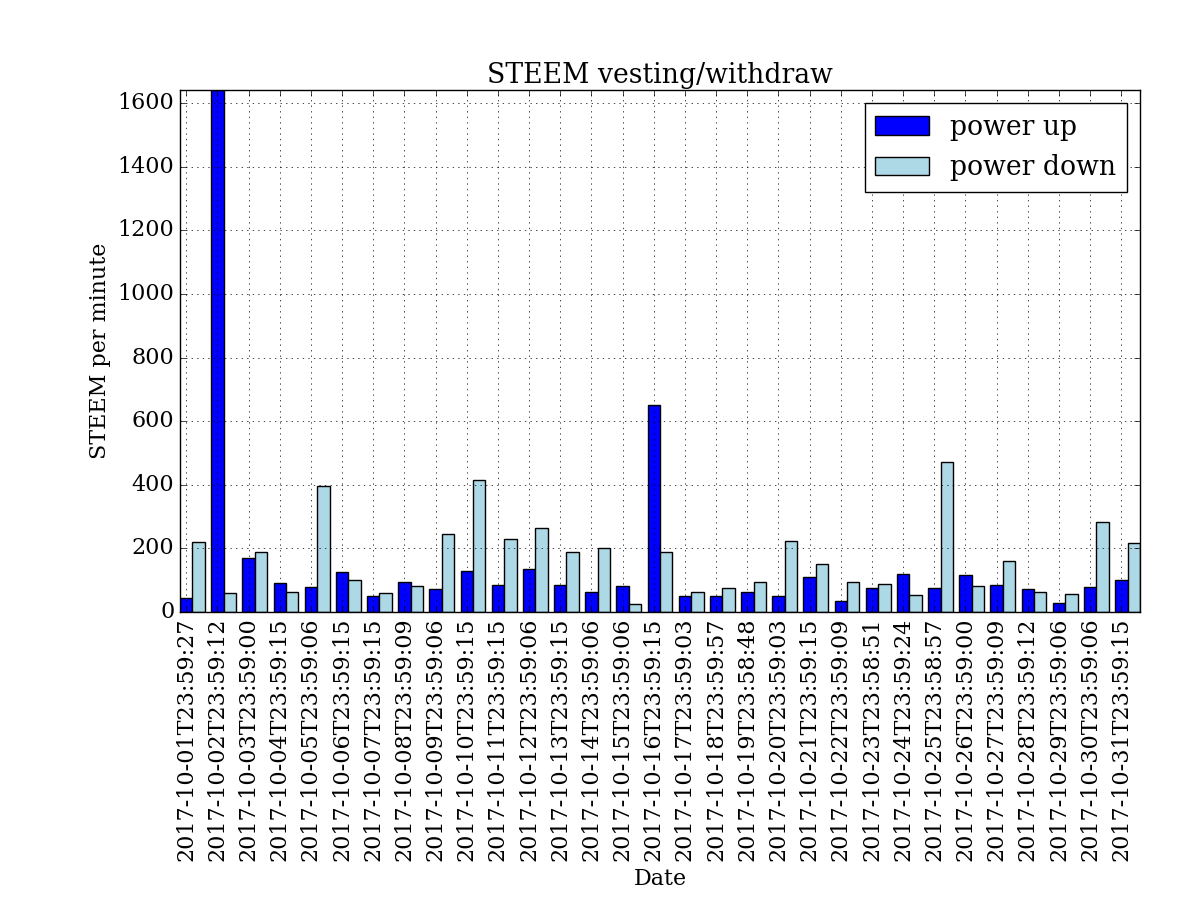
On daily chart we could see single peaks - somebody powering up while STEEM price is relative low.
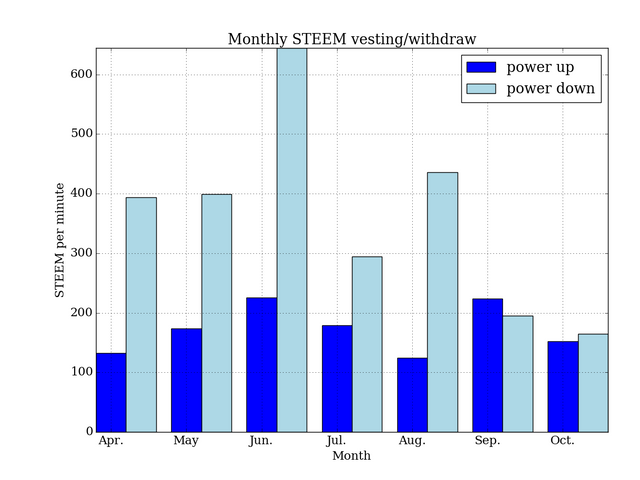
Average vesting/withdraw flows for last 2 months become more equable. It is a good sign for the Steem ecosystem.
Amazing insights, one of the best reports available
Thank you!
Simply great overview. Imho one of the best out there (yes i subbed). One silly q though - Ex - i presume is Exchange, right?
Thanks. Yes, these are flows to/from Exchanges (Ex).