"SEC | S20W2 | Data Analysis with Google Sheets: (Advanced Excel formulas, and pivot tables.)
Hello!
Welcome to my block. Interesting to fund myself here again for the week2 series.
Advance Excel Formulas in excel are usually those commands when applied help to solve complex problems that ordinarily would take man hours to complete. All mathematical functions including summation, subtraction, multiplication, probability, and other statistical indices are imbibed in it for quicker analysis.
It has made data analytics a lot simpler only if we understand how much to use these functions. Just like when we use the BODMAS to solve mathematical problems, it can also be used.in combination with other functions to generate quicker solutions.
The SUMIF, ARRAY, LOOKUP, TEXTJOIN, WORKIF, etc are some of the advance Formulas found while using the Excel sheet.
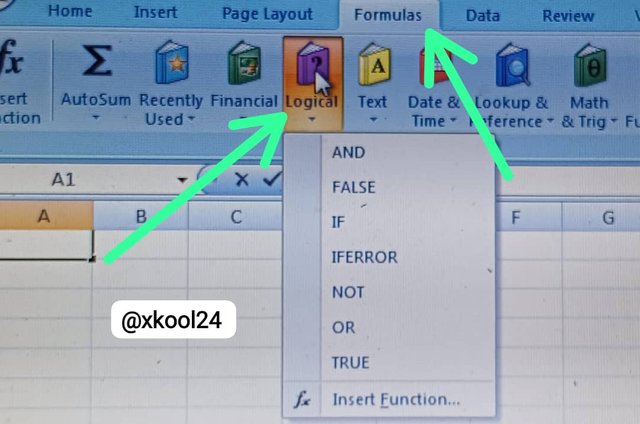
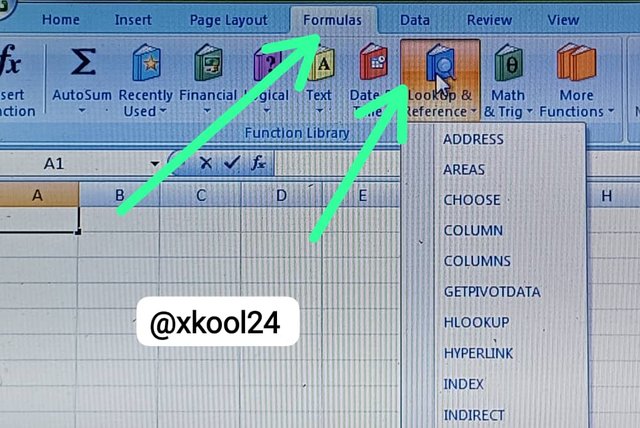
How we can find the Lookup and Logical functions:
- launch the excel spreadsheet using the laptop
- From the top tool bar, click on "Formulas" option
- Amonsgt the displayed options,.you can.see thr Logical and Lookup options.
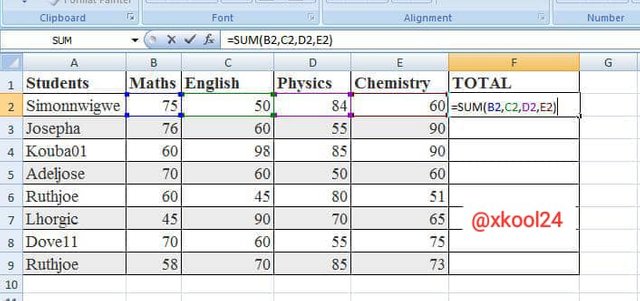
Total Summation:
. I will simply enter this command =SUM(B2,C2,D2,E2) and then click on the enter button
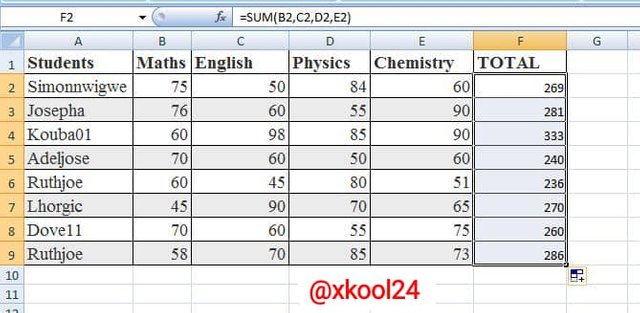
- Total for simonnwigwe is 269.
- What I need to do for other students is to place the cusor on the cell edge and drag it down to represent the same cell function to other corresponding cells.
Average:
. I will simply enter this command =AVERAGE(B2,C2,D2,E2) and then click on the enter button
- AVERAGE sum for simonnwigwe is 67.25
- What I need to do for other students is to place the cusor on the cell edge and drag it down to represent the same cell function to other corresponding cells.
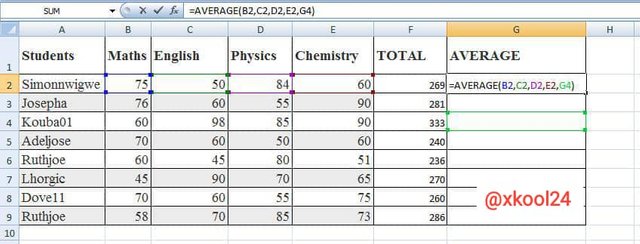
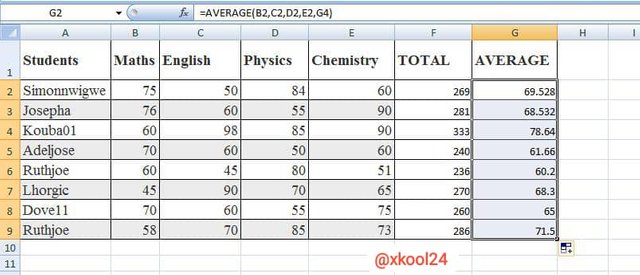
Grade:
- To get the student grades, this is to formula to achieve this command. =IF(G2>=70,"A",IF(G2>=60,"B",IF(G2>=50,"C",IF(G2>=40,"E","F")))))
Note: Still using the same grade standards as demonstrated in the class. - Grade for simonnwigwe is B
- What I need to do for other students is to place the cusor on the cell edge and drag it down to represent the same cell function to other corresponding cells.

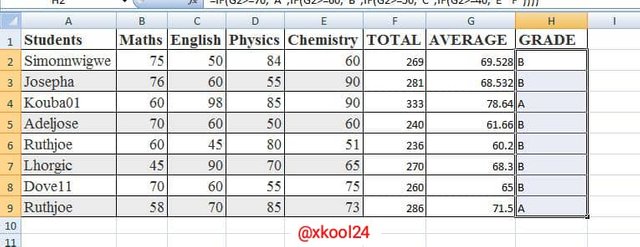
There basically for types of IFS and their application.
- IF for logical operations. We have the AND, OR, NOT
- IF for Equality commands. >,<,=,<=,>=,<>,
- IFs for multiple conditions
- IFs Error.
Step1:
- Highlight the data to be represented on the pivot table.
- Click on insert, then on pivot table
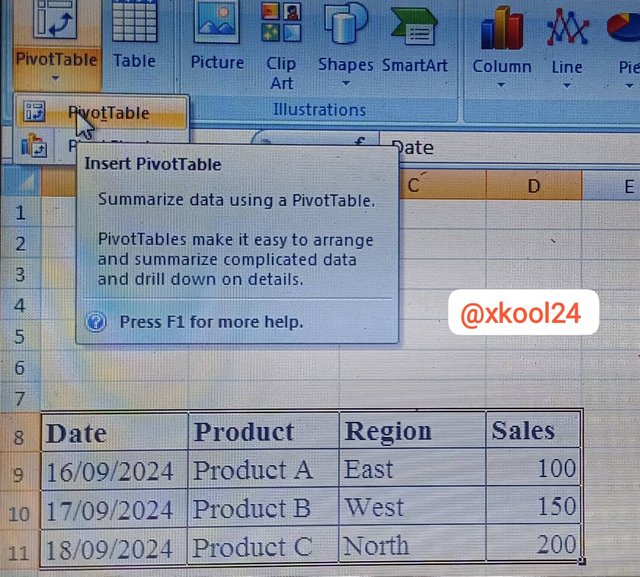
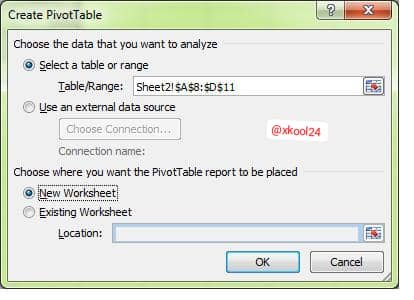
Step2
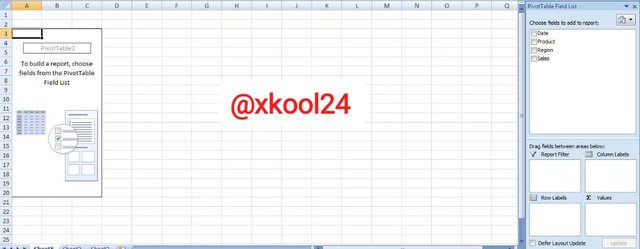
- the landing page shows a new interface where date, product, region and sales are displayed with tge corresponding report, column, row, and value filters showing.
- I will start dragging each of this item.to the requested filter box.
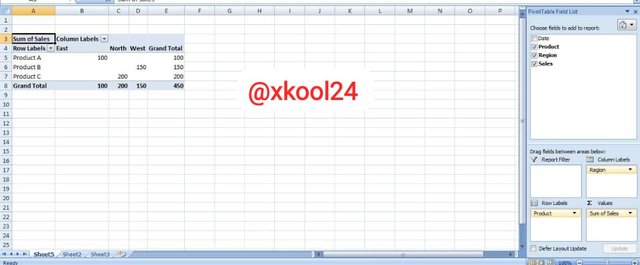
This was simple in practice but laborious to represent in publication. Thanks for the hands-on engagement and refreshment on the use of spreadsheet.
This is a lesson of its own, I read through it carefully, observing all the commands and analysis. As much as I love engagement challenge, this is truly challenging to me because I don't own a laptop.
This is one of the posts I would've really practiced if I had a laptop. Nice presentation. Best wishes and thank you for the invitation.
Hahaha, it was laborious to represent in a post. Was truly engaging and challenging.
Thanks for responding to the mention.
You're welcome sir.
This is such an informative post. Thanks for sharing thew meaningful insights with us.
Indeed, spread sheet can be very very helpful in manipulation, cleaning of data and also for data storage. it is a need for almost every one in tech and most importantly for people in data science and analysts.
I got into them when I started working on a big project that needed some serious data analysis. Learning formulas like SUMIF and LOOKUP really helped me cut down on time spent crunching numbers. I remember using LOOKUP to pull data from one sheet into another, and it felt like magic when it worked! I also found here super helpful for brushing up on my skills and picking up new tricks. The tutorials made it easier to understand how to combine functions for better results.