"SEC | S20W2 | Data Analysis with Google Sheets: (Advanced Excel formulas, and pivot tables.)
Assalam-o-Alaikum!!!
Greetings to my all STEEMIT members. Hopefully you all are fine and enjoying a great and best life on STEEMIT. I am also fine ALHAMDULLIAH. And Now I am going to share My homework task with you guys. I hope that you will appreciate me

So lets start our home work task. And I will try my best to share my best
Advanced Excel formulas are more complex functions and combinations of functions that go beyond simple math or basic operations like addition or subtraction. These formulas can manipulate data, perform logical tests, retrieve specific values, analyze large data sets, and automate tasks.
- Look up functions: These allow you to search for data within a specific range or table.
Examples: VLOOKUP(), HLOOKUP(), INDEX(), MATCH(), XLOOKUP().
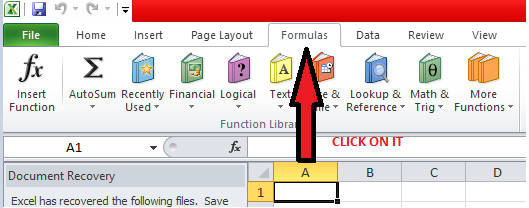
First of all, we have to look at the home tab of Microsoft Excel. In it, we will find an option which is written Formulas. If we click on the formulas, there are many more options. One option would be lookupendal reference when we look at it it will bring up many many options so there are many options it's lookup and within the reference we use
- Logical Functions: These perform tests and return values based on whether certain conditions are true or false.
Examples: IF(), AND(), OR(), NOT().
Just like here, after we've seen that we've got another option within that, we've got the logical option, the enough option, we'll see it's the logical option, we've got the logical option, and we've If you click on that option, we will get more options in the same way, which we will do inside the list.
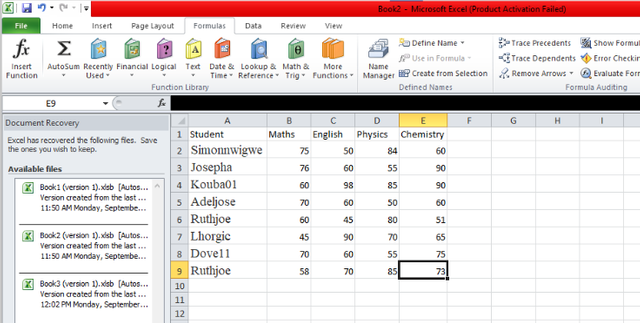
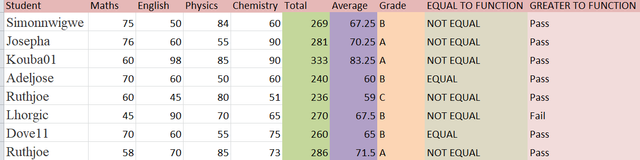
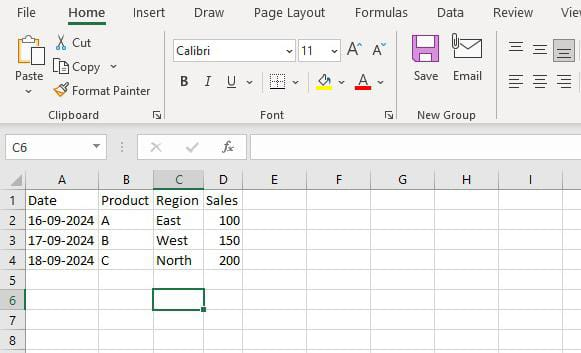
So, first of all, we will create a similar table in our excel sheet and then we will execute it through our formula according to the given things. will do and find the result, then first of all let's go then we create our own table and enter the data in it
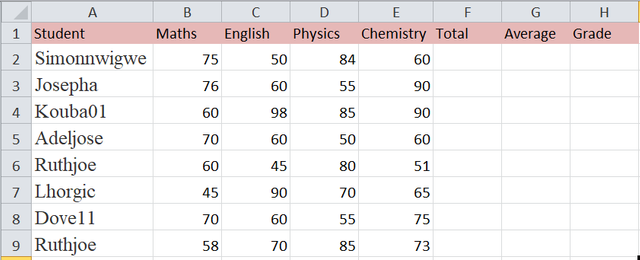
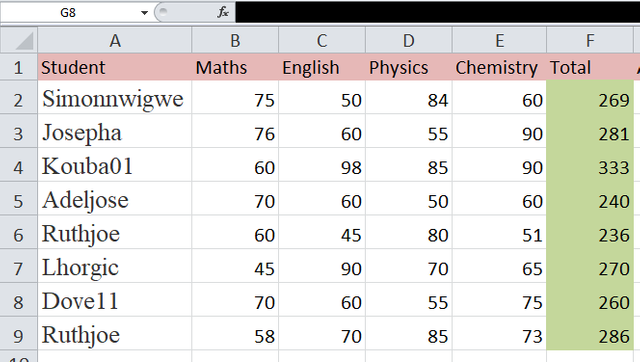
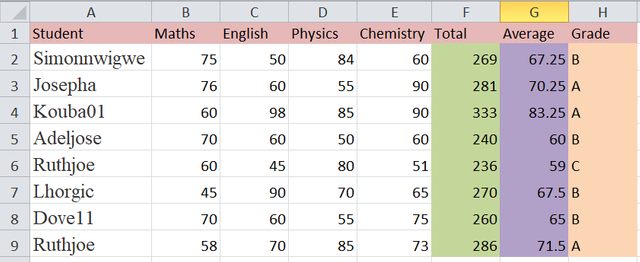
And now we will make three more columns in which we will make one where we want to total, then one will be for total and after that we will make one for average and we will make one for grade because we want people to do this. If we have to find three things, then we will make three more columns
Sum Formula:
We will add the numbers of one student by using the SUM formula and the SUM formula is
=SUM(A2:E2)
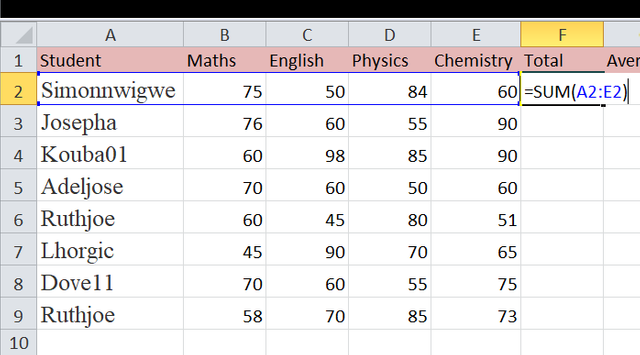
And the result is:
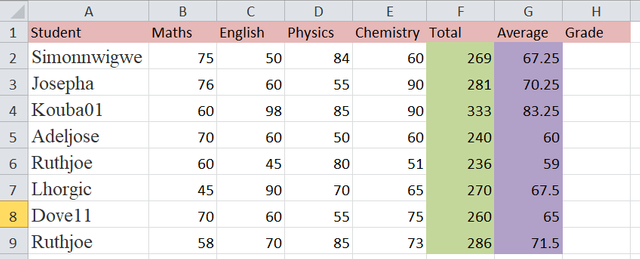
Average Formula:
Now we will fine the average of marks of the students and we will use the AVERAGE formula. And the Formula is
=AVG(A2:E2)
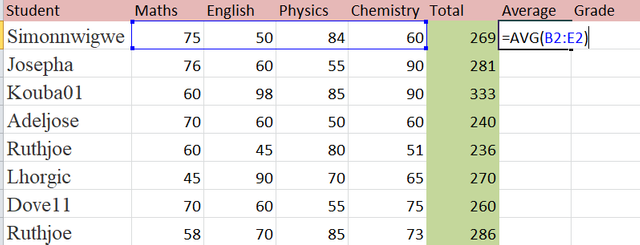
And the Result is:
Grade Formula:
Now we will fine the Grade of all students by using the Grade Formula. And the formula is
=IF(G2>=70 , "A" IF(G2>=60 , "B" IF(G2>=50 , "C" , IF(G2>=45, "D", IF(G2>=40, "E", "F")))))
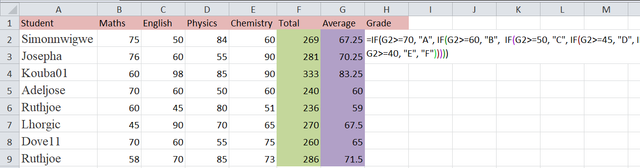
And the result is:
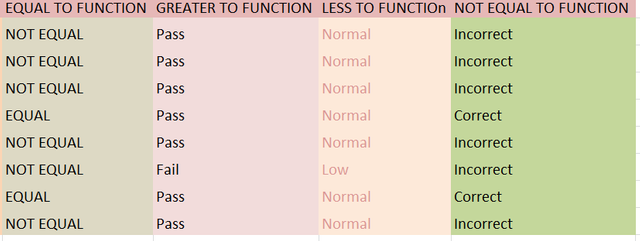
The IF function in Excel is highly versatile and can be used in combination with different operators to perform logical tests. Here are four common IF function operators:
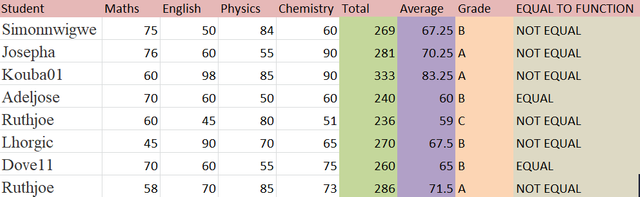
1. Equal to (=)
Function: This operator is used for the checking of two values that these two values are same or not.
When to Use
Use this operator when you want to test for equality between two values.
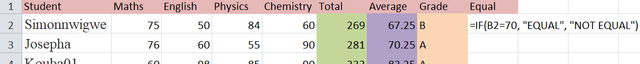
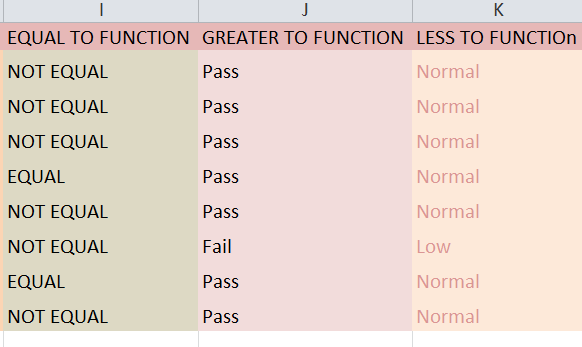
- THE RESULT OF EXAMPLE OF EQUAL TO FUNCTION:
2. Greater than (>)
Function: This checks if a value is greater than a specified number.
When to Use: Use this operator when you want to test if a value exceeds a specific threshold.
Example:
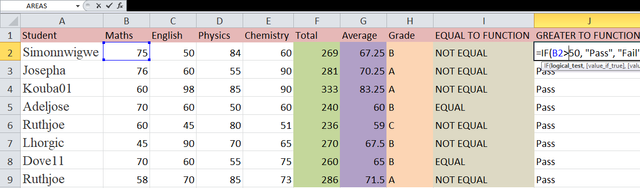
The result of the EXAMPLAE OF GREATER TO FUNCTION:
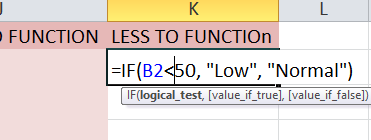
3. Less than (<)
Function: This operator checks if a value is less than a specified number.
When to Use: Use this when you need to check if a value falls below a certain limit.
And the Result is:
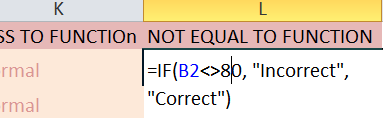
4. Not equal to (<>)
Function: This checks if two values are not equal.
When to Use: Use this operator when you want to test for inequality.
Example
And The Result is :
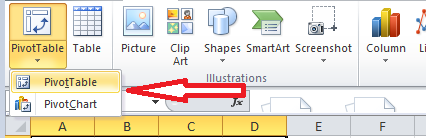
First of all we will enter the data that we have been given in our spreadsheet and after we have entered the data we will go to the next step and our next step will be to go to the insert and then click on the pivot table . Click on the option as I show you
 |  |
|---|
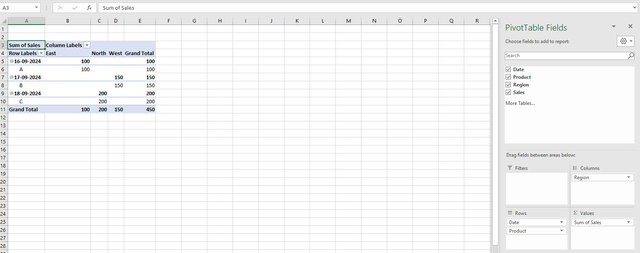
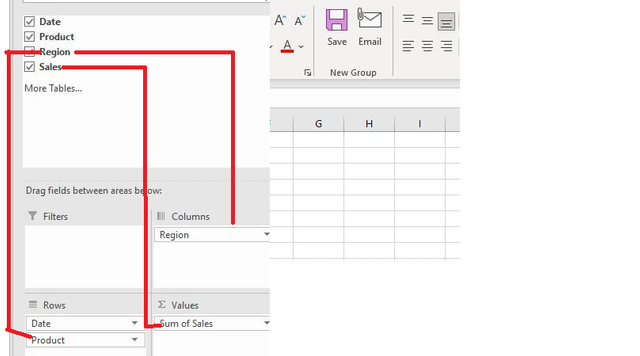
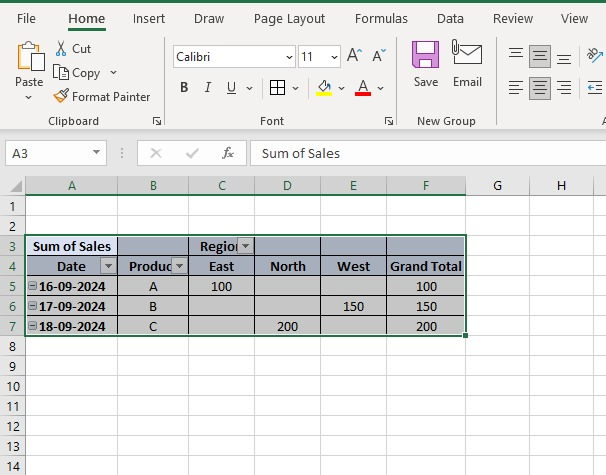
Here you can select the options in the way you want to analyze your data. Within the values within the day and within the columns, you can select the way you want the data to be displayed. can be selected
 |  |
|---|
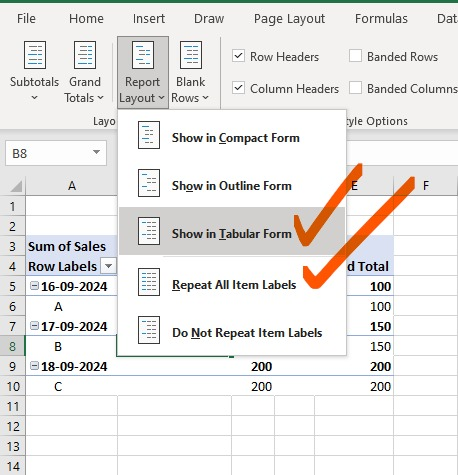
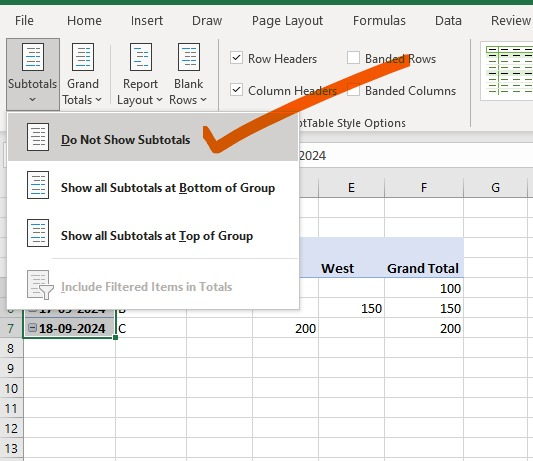
After that we will show and after that we will click on the option of subtotal etc. so that it doesn't show us subtotal again and again.
 |  |
|---|
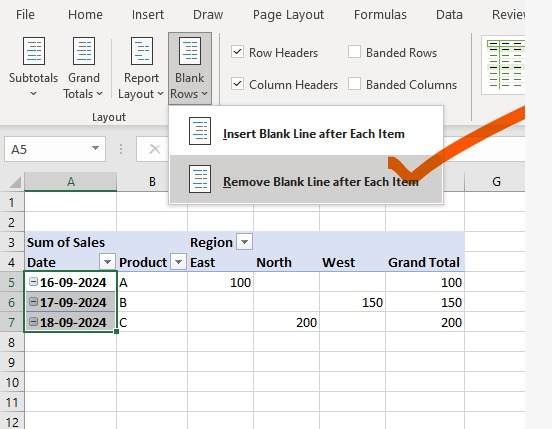
Remove here will remove the blank lines so that we don't see the blank lines when there are blank objects. This option is used to move the data inside the center line. The data inside the cap box is Seen in the center
After that i apply border and apply center alligned to make data and table nice. So its final result
So here I Completed my task. I hope that you will like because I try my best to complete it with full devotions.
Special Thanks to @josepha , @simonnwigwe
I would like to invite Friends: @wakeupkitty, @suboohi , @memamun , @alee75 , @yancar
I guess some little bird told you I never fill out a sheet?
It all sounds very confusing to me and the words and pictures are too much to understand what you are talking about. The complete overview dazzles me which can be me since too many pictures I find hard to cope with.
I understand you do have the knowledge but I can not follow what you explain let alone join these lessons. Already loading all these pictures would take me a day with my phone.
I believe it's time to ask my son or brother to make me wiser (most likely I would drive both crazy at the same time.. if I don't make them cry and say: Let me do it because it takes tooo long.
@saintkelvin17 @el-nailul @grebmot anyone in the mood to join or explain to me how or what?
0.00 SBD,
0.17 STEEM,
0.17 SP,
0.00 TRX
Greetings and thanks for calling me to check the situation. I just had a look at your comment and decided to check the other steemians you mentioned before I decided to click the full content to know the kind of post your replied to.
Damm! When I saw the post I began to scroll endlessly, I saw some steemian's usernames in the picture and that was when I even started looking at only the pictures and no longer the words because I have just a little knowledge of it.
Honestly the post discouraged me from thinking of participating in this week spreadsheet engagement challenge because I can't imagine myself uploading so many pictures in the midst of mosquitoes outside while searching for a good network.
If you calm down to read the post without getting bothered of it's appearance or longitivity, you will understand it but I assure you that you will understand it better by reading two or more other entries.
I learnt excel earlier this year but I have forgotten some things because I wasn't close to the computer system for long and we had handouts so I always study them till I get money to buy a laptop for myself.
This 👇 is a part of the handout pages and I think there's something like this in this post.
This 👇 is where I had to create this table in the system and also get the results through the layout pattern from the first image. It was a very hectic moment learning this because I kept on making mistakes.
This 👇 is also further guidelines that really helped me those days but someone need to study them first before understanding what to do next.
Am not here to explain for you to understand completely because I have forgotten about some of these things but I came here to reply your comment and also gave you little hint on it.
0.00 SBD,
8.79 STEEM,
8.79 SP,
0.00 TRX
Now I understand what it feels like when our team votes other steemians quality comment 🫡🤝.
Let's keep it up and move the platform to the right path, thank you.
I understand that you just like me list trace while readingband seeing all those puctures but what is good is that you wrote a great commemt!
I believe I indeed will look for other posts or watch youtube uniess @el-nailul shows up or my son... There is hope.
♥️🍀
Yh you deserve a positive and quality response from those you mention in your comments even if we/they don't have any idea of what you were asking in your comment.
Have a nice day 😁.
No, lol. You're on your own. I don't understand it either.
Then we should wait till someone pops up and explains @sbamsoneu @eveetim @jiya99 ... we wait...
Of all the challenges I love, this is so tasking that I'll just look and pretend as if I didn't see the post. I'll face this challenge, not a promise though.😀 But I'll try .
0.00 SBD,
0.04 STEEM,
0.04 SP,
0.00 TRX
Best of luck dear
I don't understand what is explained but I like to see your entry if you know what is meant.
My son told me I better watch a youtube video
Hahaha… funny enough, I actually want to attempt this challenge because I’ve always wanted to learn data analysis and I see this as an avenue to give it a try!!
Let me know if you can explain it to me. ♥️🍀
You sound like Judas Iscariot 😂😂. Are you scared of spreadsheets? At least next time reply her with something encouraging 😂😂
Spreadsheet is always complicated for beginners and I must say am quite back to being a beginner on it.
I've been called worse. My history with spreadsheets is indeed a dark and mysterious one. Battles without honor and humanity stretching across multiple lifetimes and dimensions. Meanwhile the original post is threatening an uneasy peace that paid with unfathomable sacrifices across time and space. Consequences would never be the same.
This post has been upvoted/supported by Team 7 via @philhughes. Our team supports content that adds to the community.
Thanks a lot for explaining some thing to all other users. It's very good. Actually this is total a practical work. And there is need of more pictures instead Of.our common post. Because I have to show all working with proof. And I tried to you every thing with own practical examples . That,s why there are lot of pictures. So don't need to be confused and started to get knowledge one by one. If we will.think.that there there is too much then we will confuses. But it's really very easy
Congratulations, your post has been upvoted by @scilwa, which is a curating account for @R2cornell's Discord Community. We can also be found on our hive community & peakd as well as on my Discord Server
Felicitaciones, su publication ha sido votado por @scilwa. También puedo ser encontrado en nuestra comunidad de colmena y Peakd así como en mi servidor de discordia
Thank you so much @scilwa