Scalping: 4 tools to trade well
Today in this article, I would like to discuss with you a subject too often left unanswered: the right tools dedicated to scalping. Indeed, there is a non-exhaustive and very large number of tools present on trading platforms . However, this wide choice is not a gift, but rather a burden when it comes time to create your scalper setup.
It must be kept in mind that the trader, and more particularly the scalper, remains a human being like any other with his emotions, his joys and his sorrows. All this has a direct impact on trading performance, so it is essential to turn to tools that leave little room for interpretation. The best tools are framed or are quantitative tools whose result is clear and net. For example 1+1=2, there is no other possible interpretation.
After more than 7 years of experience as a scalper, I am going to present to you some tools that I personally find interesting when one wishes to acquire a certain level as a scalper.
The pivot points;
The pivot point indicator has been one of the most well-known trading tools for many years. Whether it's a beginner, confirmed or professional audience, the majority of traders end up using it, regardless of how it is interpreted in everyone's trading strategies.
This tool has the function of highlighting the point of neutrality (called the pivot point) as well as the different levels of support and resistance associated with it.
The strength of this tool is that the levels are displayed on the trading platform, before the analysis period begins to show on the charts. Thus, the trader is ahead of the prices.
Example: A daily pivot point at 15,075 will remain a pivot point at 15,075 until the end of the day, just as a monthly pivot point at 2,567 will remain until the end of the current month at 2,567. to have fixed levels and not moving levels to which you must constantly adapt (as is the case, for example, with moving averages).
Personally, I do not trade the breakouts of the different levels. I prefer to work on rebounds with an elasticity ruler. Of course, it's up to you to try trading breakouts, but my experience tells me that this is not the best use of pivot points for scalping.
The pivot points indicator is calculated in different ways, but the best known is this:
Pivot = (H+B+C)/3
S1 = (2 x pivot) – H
S2 = (pivot – (HB)
R1 = (2 x pivot) – B
R2 = Pivot + (HB)
As well as the different middle levels:
S = support
R = resistance
H = yesterday's high
B = yesterday's low
C = closing yard
Volume Profiles;
The “volume profiles” tool is a tool that is gradually starting to become known in France, despite a significant delay compared to our Germanic or Anglo-Saxon neighbors. Moreover, for the little anecdote, it was in Austria that one of my good friends (Dario) spoke to me about it for the first time, and it is also in this magnificent country that I was trained in the use of "volume profiles" for a relatively long period.
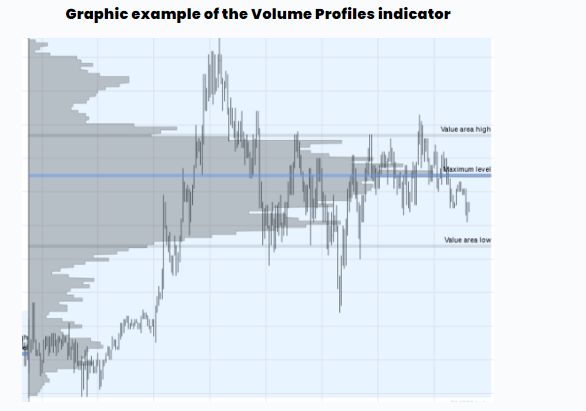
The "volume profiles" tool is a singular graphical representation which aims to flatten the volume of the price vertically in the form of a histogram. This way of doing things makes it possible to identify different key levels that are very relevant for a given period. If we take the example of daily profile volumes, they will move until the day's session is over, then at the end of the session they will freeze.
There are two approaches that coexist: traders who will trade the levels of the day when they are in motion and there are traders who will trade the frozen movements of the previous days.
“For my part, I prefer to trade fixed movements because they are definitively fixed. This is the core of my [1+1=2] approach”.
The "volume profiles" tool is made up of different points in order of relevance.
– First of all, there is the “ POC (Point Of Control)”, which is the most important element of the “volume profiles” tool since it makes it possible to identify at what price level, during a period defined, there was the most volume traded.
– Then there is also the “VA (Value Area)” which is an area representing the place where 70% of the volume traded has been worked.
– Then, there is the “VAH (High Value Area)” which is a level considered as the upper border between the 70% volume zone and the rest.
– And finally, there is the “VAL (Value Area Basse)” which is a level considered as a lower border between the 70% volume zone and the rest.
The Market Profile;
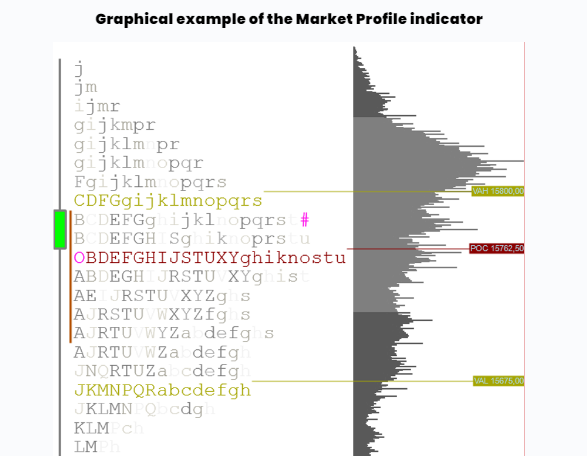
The “market profile” tool is a tool created in the 1980s which was mainly and for a long time used by financial market professionals. The “market profile” is visually quite similar to the “volume profile” in form, but the resemblance ends there.
Indeed, as we have seen previously, the "volume profile" is calculated on the volume, while the "market profile" is calculated on the time spent on each price level. Its shape is formed by the compression of the different letters of the alphabet.
Visually, we therefore have the price on the y-axis and the time on the x-axis, in an initial "time frame" of 30 minutes. The first half hour is represented by the letter A, then the second half hour by the letter B, etc. Everything is then compressed in order to have the visual that we know, namely the shape of a histogram placed vertically.
These different forms of "profile" fall into 2 different categories:
an unbalanced structure;
an unbalanced structure.
Then, in these 2 categories are classified different very precise structures which will indicate to the trader the potential directions which it will be necessary to anticipate.
The opening is materialized by an "O" and the closing by a "♯".
We also find there the “POC (Point Of Control)”, which is an important element of the “market profile” tool since it makes it possible to identify on which price level the participants have remained the longest.
We also find the “VAL” and the “VAH” there.
The order book;
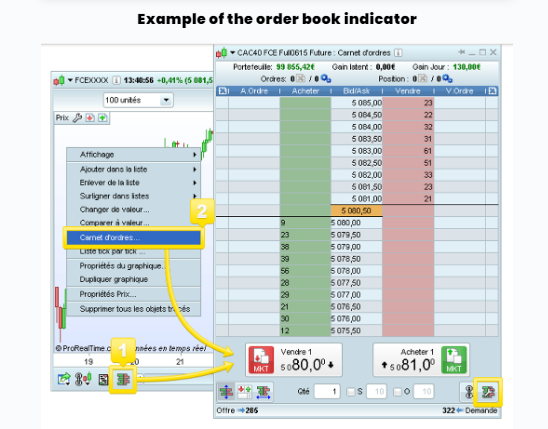
The order book is a scary tool because of its visual aspect which can seem complex on some trading platforms. However, this is not the case because once you have passed this barrier of "the first impression", you will find in this tool a real friend for scalping.
The order book is a bit like a computer register containing the various buy orders as well as the various sell orders by price level, hence its aptly named “order book”.
The order book is continuously updated whenever a price change occurs. This tool therefore allows you to have a timely visual of the state of the market, between supply and demand, with an overview of the amounts.
Some trading experts only scalp with the order book as their only tool. This is not easy and it will take years of experience to achieve this feat.
On the other hand, knowing how to use an order book to confirm the different technical levels is a very interesting thing that can be put into practice quite quickly when you start scalping.
We also find the concept of "spread" in the order book, which will serve to get an idea of the nervousness of the market. It should be remembered that the greater the “spread” the more nervous the market will be.
Additional tips for successful scalping trading;
A good mastery of these four tools will be of great use to succeed in scalping, but you will also have to learn to control your emotions and trust your strategy and the indicators that compose it. It will also be necessary to set up a rigorous money management and to choose the appropriate stock broker . So many elements that we will no doubt have the opportunity to detail in future articles.
