Catastrophic Global Warming and the Medieval Warm Period.
[This is a piece I drafted a few years ago but never finished. I'm posting it in raw form for a friend.]
http://realclimatescience.com/2016/12/100-of-us-warming-is-due-to-noaa-data-tampering/

I received an astonishing email from a major researcher in the area of climate change. He said, "We have to get rid of the Medieval Warm Period."
Catastrophic Anthropogenic Global Warming (CAGW or AGW) is in mixed parts a scientific question and political topic. Roughly speaking, for the right of the political spectrum, the scientific question has been answered: there is a much bigger threat of global cooling than from run-away global warming; for the left, CAGW caused by Man's addition of Co2 to the atmosphere is ‘settled science’ and an existential threat to human-kind. The left demands political action now, while denouncing ‘deniers’. The right thinks there is nothing to be alarmed about.
One of the issues in this debate is whether the Roman Warm Period (“RWP”) and the Medieval Warm Period (“MWP”) where warmer than today. If these periods were as warm or warmer than today, then the odds are that the Modern Warm Period is not abnormal, and the addition of carbon dioxide to the atmosphere is not spurring a temperature increase. Proponents of AGW have worked assiduously to remove the Medieval Warm Period or show that the MWP was cooler than today.
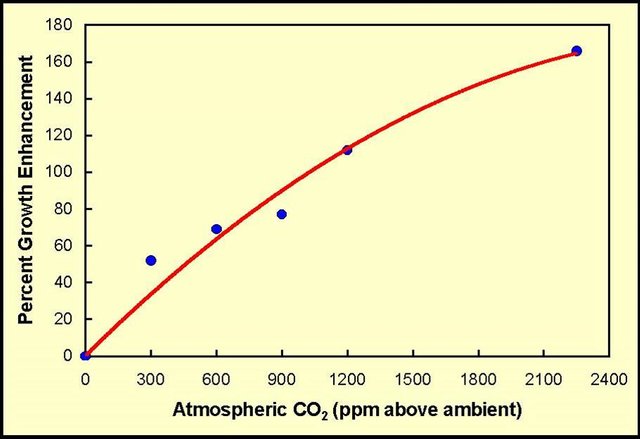
As a preliminary matter, consider Co2's ability to affect temperature. In Earth's history, Co2 has been much higher than today. The ability of Co2 to capture heat (the "Greenhouse Effect") happens mostly at low Co2 concentrations. Co2 is currently at a level (saturation) where its effect is diminishing exponentially with respect to its heat-capture in the atmosphere:
I won’t go further into the topic of Co2 saturation, but peruse this blog by the incomparable Lubos Motl:
the greenhouse effect gets weaker as the absorption of the appropriate spectral lines gets saturated, [and]
the overall greenhouse effect from several gases is smaller than a simple sum if their spectra overlap.
The past can be broken into three tranches for temperature measurement purposes: the Modern Era, which has direct measurements of temperature; the Historical Era, which has only proxies for temperature (e.g. ice cores, tree rings, sediments), plus human records and artifacts that indicate whether it was hot or cold; and the Deep-Time Era, in which we have only temperature proxies. The MWP and RWP occurred between 800 and 1300 AD and between 250 BC to 400 AD, respectively, and fall within the Historical Era.
Deep Time: Wide Swings in Temperature and Co2
Here are some uncontroversial reconstructions of Earth's temperature in the Deep-time Era. The first is temperature on a logarithmic timescale from Wiki
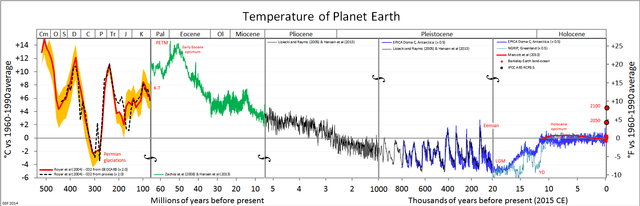
The blue oscillations between 30 and 1000 thousand YBP are glaciations.
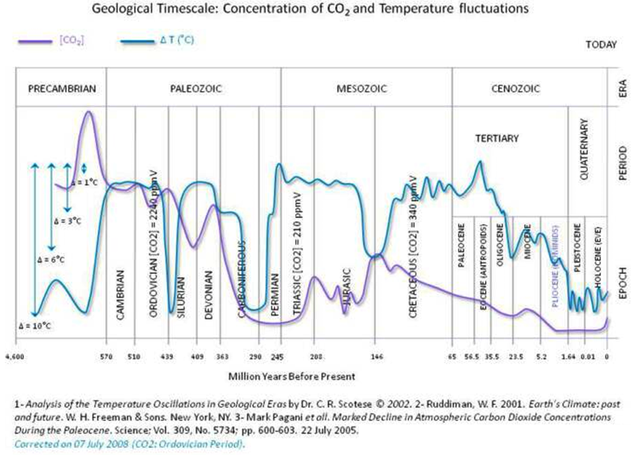
The following figure shows a reconstruction of temperature with Co2 with time again on a logarithmic scale. There is no correlation between temperature and Co2 level:
Figure
Finally, a plot on a linear timescale with absolute numbers for temperature and Co2.
Figure
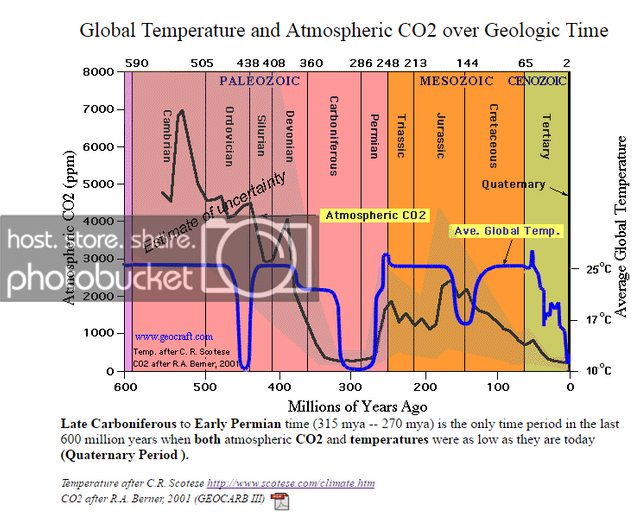
All three graphs are similar. At the right of [the final graph] we see temperature ending at about 13 degrees C, and estimates of current average global temperature are somewhere between 13.5 and 14.5 degrees C. The maxima of the temperatures in the Deep-time Era are about 25 degrees C, or about 8 to 10 degrees warmer than today. Also, Co2 are near a minima today, about 385 ppm. Co2 has been this low only in the Carboniferous period (about 300 million years ago) and typically has been much higher (1000 ppm and more) across time. The Modern Era is anomalously low in temperature and Co2. See, e.g. 2014 among the 3% coldest years in 10,000 years
Figure (2) shows ice core data (I think from Vostok).
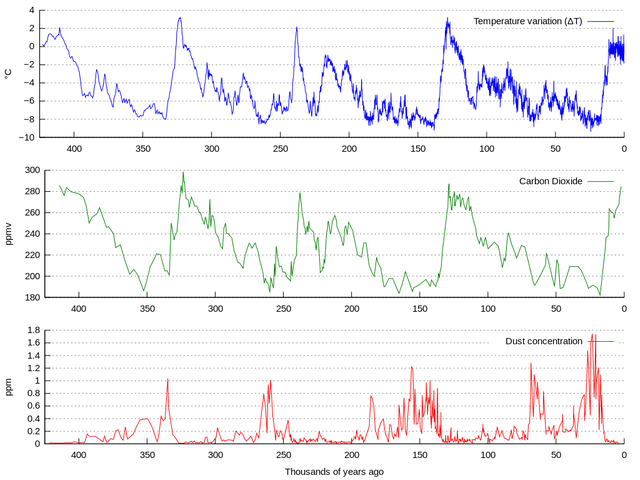
By Vostok-ice-core-petit.png: NOAAderivative work: Autopilot (talk) - Vostok-ice-core-petit.png, CC BY-SA 3.0,
It reveals that ‘currently’ we are in a warm interglacial period, and this pulse is a little longer (and a little cooler) than previous ones, suggesting a new ice age may be around the corner. Co2 lags temperature by about 800-1400 years, but some researchers suggest that the lag is as little as 200 years as a result of air bubble migration. Still Co2 doesn’t lead temperature.
Historical Era
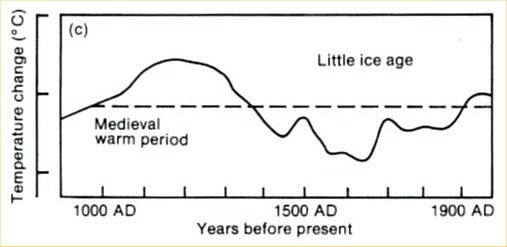
Next, the Historical Era, and the argument about the MWP. The state of the art circa 1990 is depicted in A4 and A5 (from the IPCC first report – they have disappeared it since). Figure A6 shows similar results over a longer period. Figures A4/A5 and A6 shows the MWP as significantly warmer than now.
Here are compilations of a large number of studies: 1 2 3
Here’s a compilation of 18 studies by Loehle (2007) “A 2000-year global temperature reconstruction based on non-treeing proxies” that shows that the MWP was warmer or as warm as today through 1935:
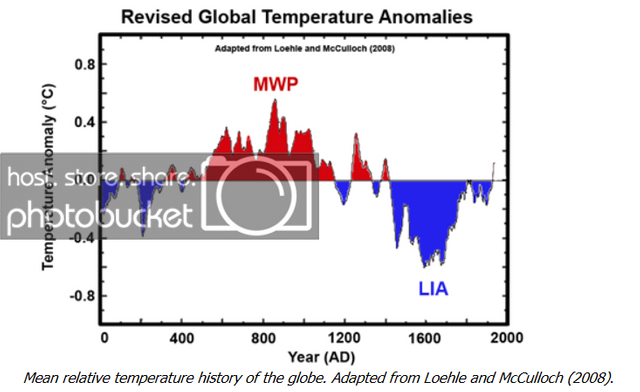
"the mean series shows the Medieval Warm Period (MWP) and Little Ice Age (LIA) quite clearly, with the MWP being approximately 0.3°C warmer than 20th century values."
Hey, the reconstruction looks just like the IPCC graph from 1990 (Figure A5)! This recent paper pretty much puts the hysteria about AGW to rest.
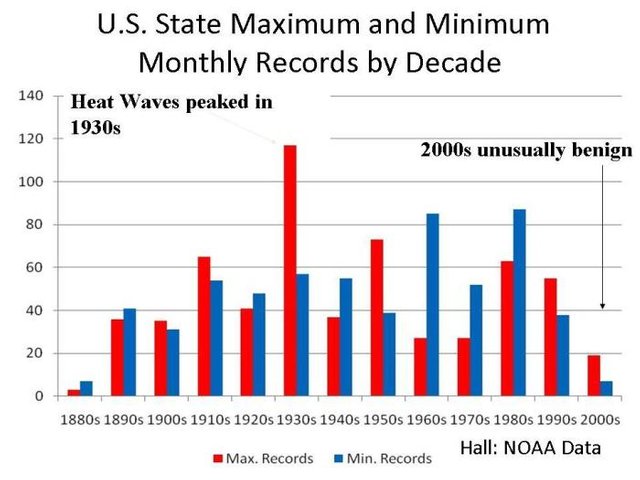
1935 was a propeitious year for Loehle's series to end. It was in the midst of a heatwave, at least based on all-time record high temperatures recorded in the States:
Note that sea level was 2 meters higher than today twice in the last 8,000 years (during the Holocene Temperature Optimum):
The temperature data alone refutes the hypothesis that the MWP was cooler than today but there is incontestable data during the Historical Period – human records and artifacts. Farming (especially in alpine valleys and geographic limits of grape and wheat cultivation), ancient tree-lines, artifacts melting out of glaciers, Vikings buried in permafrost in Greenland, temperature sensitive insect range, and many more human records of the past all support a very warm medieval (and Roman) period.
Probably the best example is the Vikings. The Viking settled Iceland, Greenland and (maybe) Labrador/Newfoundland during this period. These settlements all disappeared during the Little Ice Age. Here’s a selection of the Viking’s travels.
http://www.green-agenda.com/greenland.html
Here’s another piece (translated – a little roughly -- from the original Germany) which, in the first part, lists a number of human examples showing the MWD was warmer than today:
And if you think we’re arguing regional variations, as IPCC does when it suits them, consider this:
The Medieval Warm Period - A global Phenomenon
http://pages.science-skeptical.de/MWP/MedievalWarmPeriod.html
Modern Era
There are no direct measurements of temperature prior to about 1650, which marks the beginning of the Modern Era, cumulating in 1979 with the recording of high-quality, uniform satellite temperature data. 1850 is generally agreed as the end of the Little Ice Age. From Encyclopedia Britannica:
Little Ice Age (LIA), climate interval that occurred from the early 14th century through the mid-19th century, when mountain glaciers expanded at several locations, including the European Alps, New Zealand, Alaska, and the southern Andes, and mean annual temperatures across the Northern Hemisphere declined by 0.6 °C (1.1 °F) relative to the average temperature between 1000 and 2000 ce.
http://www.britannica.com/EBchecked/topic/344106/Little-Ice-Age-LIA
Wiki1 shows the minima of the Little Ice Age occurring at around 1650 and the total increase from there until present of about 0.6 to 0.7 degrees (about 0.185 degrees C per century). That would suggest that current temperatures are about the ‘average temperature between 1000 and 2000 ce’. In other words, not a crisis.
The Wiki1 plots showing an accelerating increase in temperature from the mid-1850’s (when the industrial revolution was kicking into high gear) to the present (about 0.33 degrees C per century). This matches theory in that carbon emmissions increase temperature.
Let’s look at some data sets. Figure A1 shows satellite data for the period beginning in 1980.
http://www.davidarchibald.info/papers/Past-and-Future-of-Climate.pdf
Eye-balling it, a least squares fit might result in 0.3 degrees per century, but you could also argue it’s nearly flat. The Southern Hemisphere is flat, and one could wonder if the Northern Hemisphere rise is due (in part or in whole) to heat-island effect, rather than global warming.
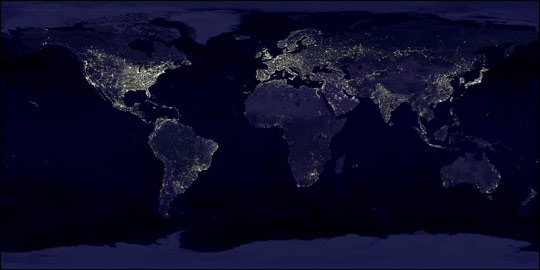
The Equator runs through Quito, Ecuador, not too far south of the top of South America. The N. Hemisphere has most of the lights, which correlate with industrialization/heat island effect.
Incidental, here are a few government assessments of the global temperature anomaly. It shows an increase of about 0.45 degrees C from 1980 when satellite data started. Obviously the government plot is not supported by the satellite data.
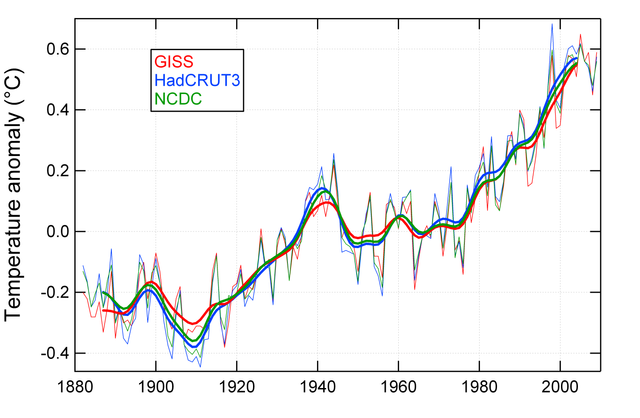
Figure A2 is from a composite of rural temperature stations in the U.S., which covers the period from 1893 to 2004. It shows a modest least squares fit decline, or at most 0 (zero) degrees change per century. (See heat island discussion below). Note this period covers most of 1850-present period in which the Wiki1 temperature increases by 0.33 per century.
Next, Figure A3 from the UK starts in 1661 and represents the longest continuous temperature dataset available. The Dalton and Maunder Minimum are well-documented cool periods within the Little Ice Age. A channel can be drawn from 1730 to 1950 on the highs, and 1750 to 1970 on the lows, where there is essential no change in temperature. The tail end of this dataset (from about 1950 onwards) shows some heat island effect. Interestingly, NOAA presents this same dataset and says “The temperatures from 1975-2005 have been corrected for urban warming”. As near as I can tell, NOAA ‘corrected’ the temperatures for the heat island effect by increasing them instead of decreasing them. The raw data shows the 1735 peak is about the same as in 2005, but the NOAA data shows today as warmer than 1735 after ‘correction’.
In summary, various recent datasets based on raw, real temperature readings, not proxies, do not support hysteria. That’s without getting into a bunch of other substantiated concerns, including: heat island effect, lack of stations, cherry-picking of data sets, and flawed data analysis. As to lack of stations, they declined sharply beginning in 1980 with the advent of satellite data (middle graph): 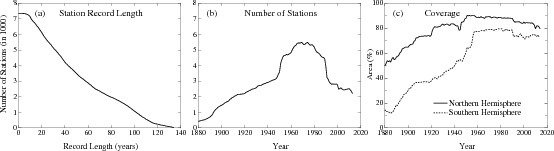
The Past and Future of Climate Change
From the Deep-Time Era we can conclude that average global temperature and Co2 levels are near global minima, that we are at the peak warm period of an interglacial period, and that almost certainly in the future the Earth will experience another major ice age, with a mile of ice burying places like Russia, Canada and most of the Mid-West (unless we do something about it). From the Modern Era, we see that many data sets do not show systemic warming (the last 18 years of the hiatus haven’t shown any) including the best temperature record of the period, the satellite data. For the Historic Era, I shown several recent high quality reconstructions of temperature that include the MWP to the present in which the MWP is warmer than the present and the reconstructions are about the same as the cartoon representing the “settled science” contained in the first IPCC study (1990) but since discarded (Fig. 5A). Human reports and archaeology confirm Fig. 5A. Wiki is heavily biased toward AGW,
and I’ve shown that Wiki1 is essentially a ‘hockey stick’ that contains the discredited work of Mann et al (1998).
Hence, the MWP was at least as warm as today or warmer. It certainly wasn’t cooler.
P.S.
Urban Heat Island (UHI) effect.
The Impact of UHI
One of the biggest factors to consider when trying to compile an accurate temperature is the UHI effect - something that appears to be substantially downplayed by the IPCC, but particularly relevant as a significant proportion of the worlds records increasingly come from urbanized areas. The link to population growth (here) illustrates how the environs of a station may have changed over the years.
The precise amount of artificial warming through proximity of buildings, vehicles, tarmac etc will vary according to whether the station remains in a large open space or becomes crowded in by development. There is clearly a limit to the UHI effect - as urbanisation grows artificial warming is likely to be spread more widely but will not necessarily be more concentrated. However, a difference of several degrees between urban and adjacent rural areas is common and the effect is particularly marked on still clear nights when the difference can be substantially greater. This renders many modern temperature records rather suspect as the correction factor (if applied) often appears to be inadequate. The end result is that the recorded temperature may read rather higher than it should do when trying to compare like for like with older less affected records.
The warming caused locally by the UHI effect is unambiguous. Some urban areas will welcome the additional warming, but to others it will be a real issue. However it appears to be one that does not attract as much attention as the much less obvious impact of co2.
http://climatereason.com/UHI/
Abrupt Decline in Earth Based Temperature Stations
With the advent of high quality satellite temperature data (Figure A1) the number of earth-based temperature stations has declined precipitously since 1980, in part, because so many stations have been render practically useless as a result of UHI effect.
(middle figure; cited above)
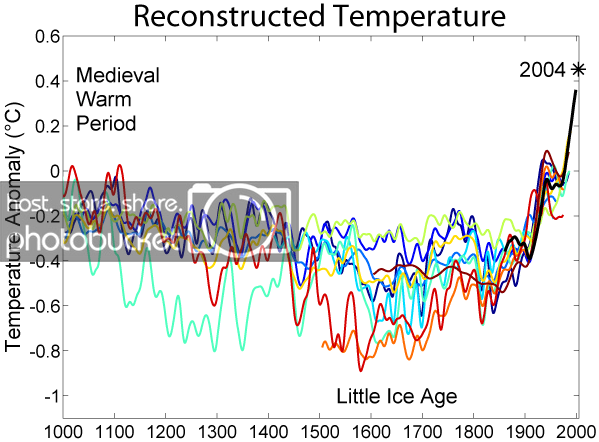
c1/2000_Year_Temperature_Comparison.png

I’ll refer to the Wiki temperature plots as Wiki1.
Patrick Moore, Ph.D., a co-founder and leader of Greenpeace for 15 years, wrote a contrarian piece on global warming from which three questions can be abstracted:
Issue 1: Were the pre-Industrial Medieval Warm Period and the Roman Warm Period warmer than today? If so, why should we panic about minor warming today?
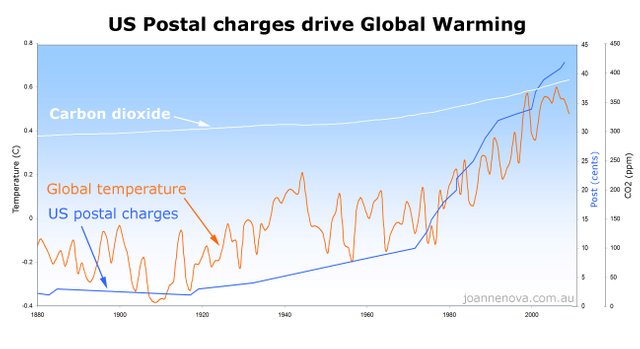
Issue 2: Is global warming about science, or is it just the Left trying to stampede the voters into accepting it’s favored programs, like massive carbon taxes?
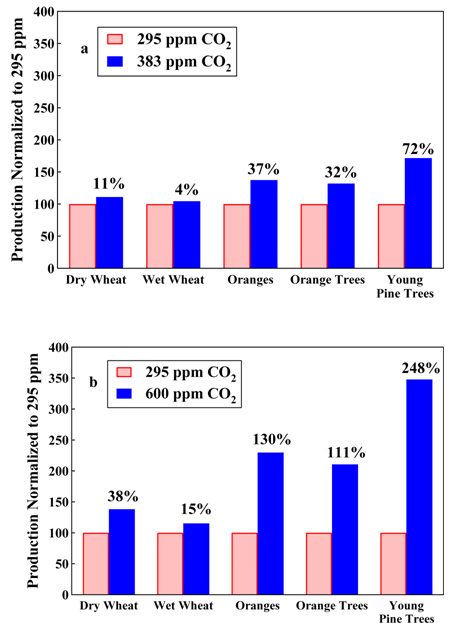
Issue 3: Has increased carbon dioxide been a boon to plants? Is/was carbon dioxide dangerously low (plants starting dying around 200 ppm), and has Man’s emissions of Co2 actually been beneficial?
Congratulations @redq! You have completed the following achievement on the Steem blockchain and have been rewarded with new badge(s) :
You can view your badges on your Steem Board and compare to others on the Steem Ranking
If you no longer want to receive notifications, reply to this comment with the word
STOPTo support your work, I also upvoted your post!
Vote for @Steemitboard as a witness to get one more award and increased upvotes!
Congratulations @redq! You received a personal award!
You can view your badges on your Steem Board and compare to others on the Steem Ranking
Vote for @Steemitboard as a witness to get one more award and increased upvotes!