Technical Analysis XRP / BTC
In the last technical analysis I was saying that I expect the price to go down to 0.0000500btc, even make a jump down to 0.0000250btc. This analysis also included the drop-off effect given by segwit BTC to all crypto coins. Here's what the news about the BTC, namely #uASF BIT 91 that has reached 84% at the moment, has made the BTC price break the resistance line upwards and go to the previous maximum price. This undoubtedly gave a positive boost to cryptocoin. In these cases, however, the technical analysis is very uncertain. Always when expecting news or fundamental events about the BTC (in our case), the technical analysis is no longer accurate on any other cryptocoin. This type of news can move the market up or down in a way that no longer has to do with technical analysis.
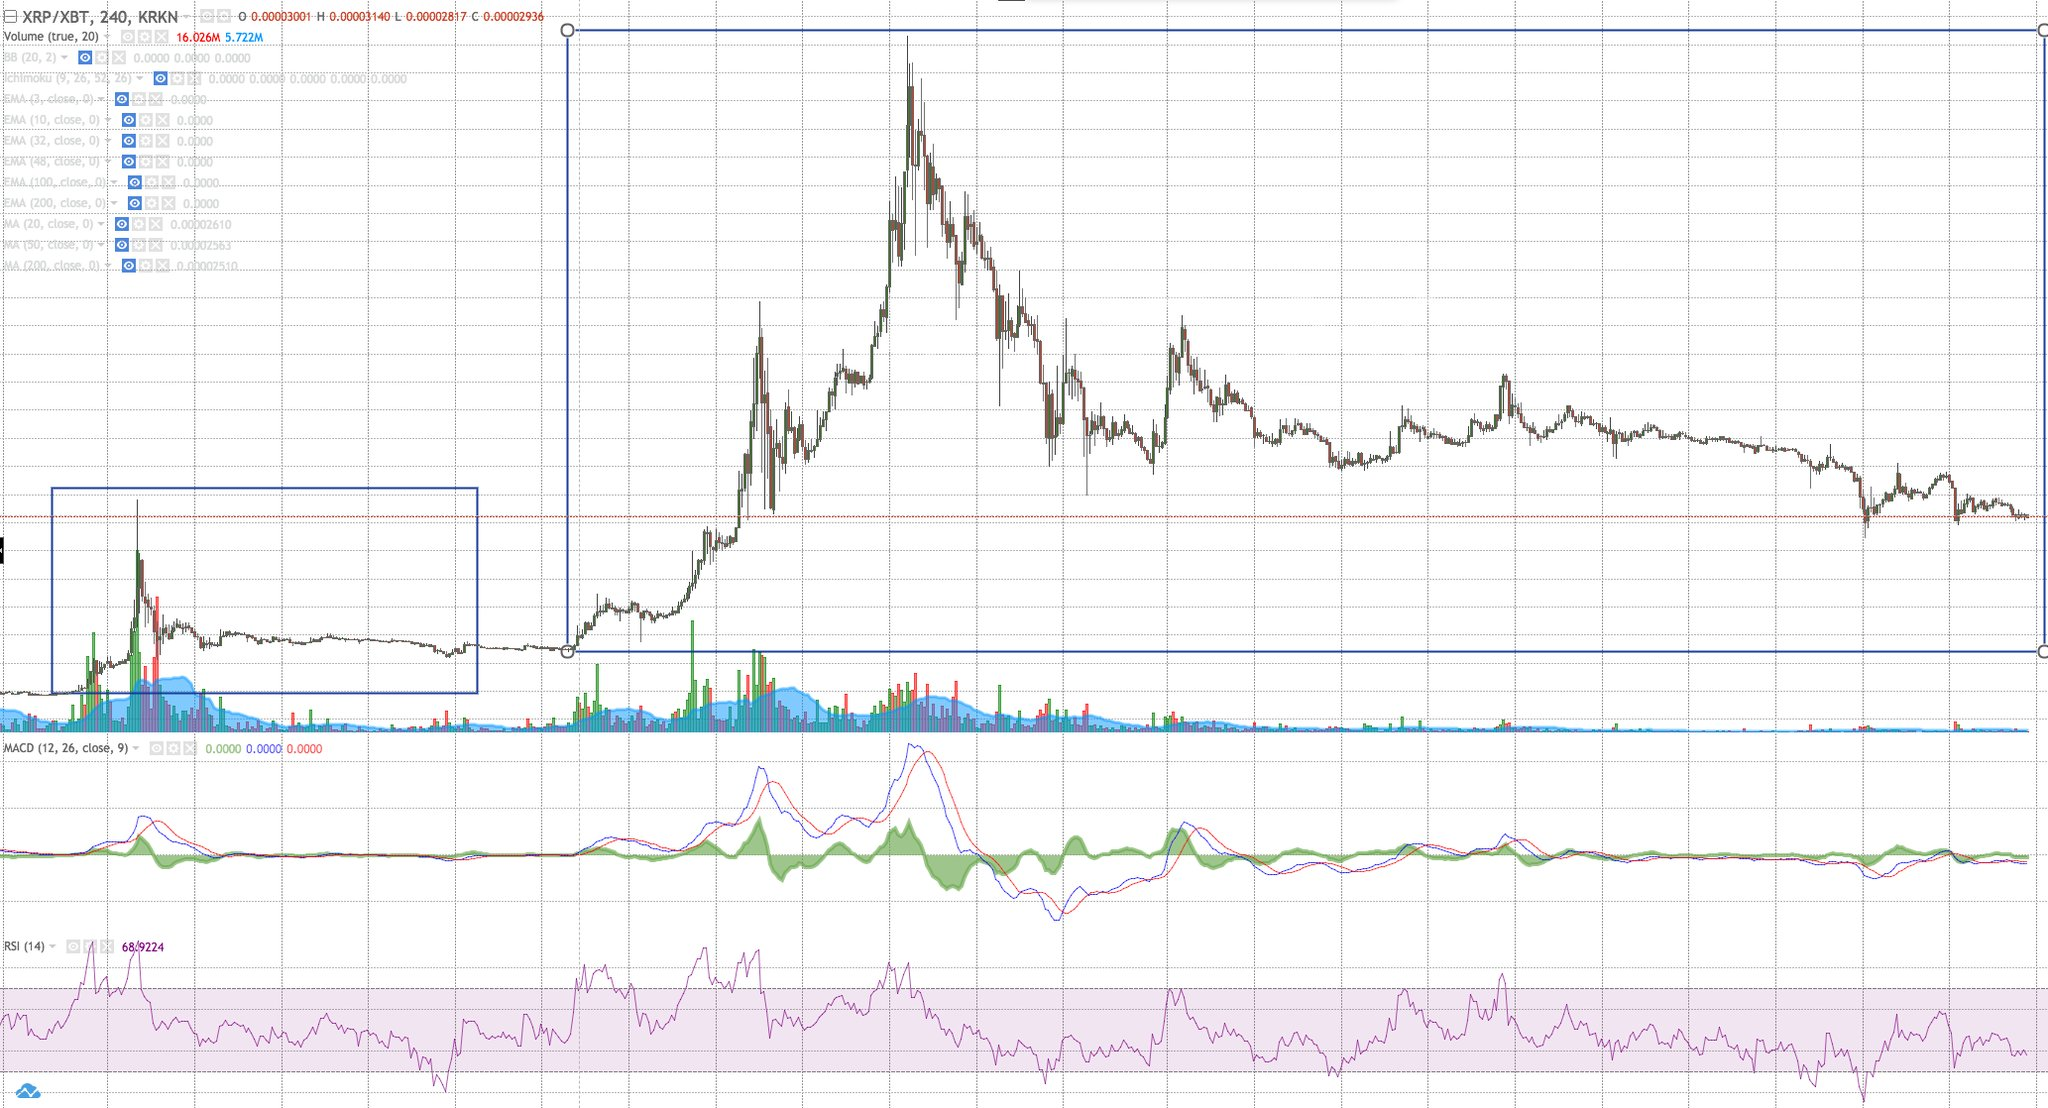
XRP / USD synchronized yesterday with BTC and ETH increases but today he also paused. But what does XRP / BTC do?
XRP / BTC follows its own path.
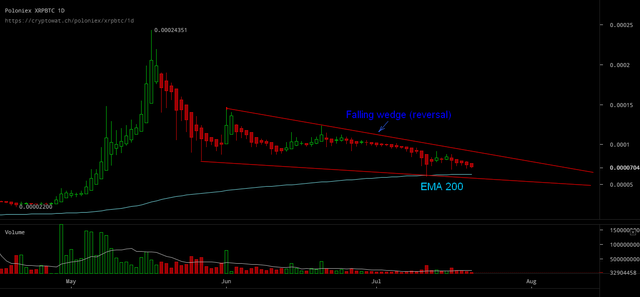
Here's the chart, drawn in red, we have a Falling Wedge pattern (reversal). This is a bull pattern. Usually the price breaks the upper line of the pattern and the current trend is reversed. Unfortunately, the volumes currently traded on XRP are very low. Lately I've had a lot of positive news on Ripple, but XRP is stubborn to drop easily and steadily. This is what happens in any market without the big buyers (whales). All of these cumulative news and others that will follow will cause the price to go up at some point. In conclusion: patience and tobacco!
Trend in the next few days: slight drops. It remains to be seen if the Falling Wedge pattern is confirmed and we will move upwards. But I do not expect this short-term move (this week). If not, the EMA 200 will be tested again and if it will be crashed down we expect a long period of light drops or consolidation. Waiting for the whales!
History always repeats itself