A Complete Guide to Reporting Solutions
Today, I will tell you how to develop reporting system that meet all relevant personnel’s needs in the reporting system.
Reporting solutions play a critical function in business operations. It frees you from the burden of reporting work and allows you to build valuable reports efficiently and manage these reports easily. Besides, reporting solutions support managers put together a picture of the relevant data and discover business insides.
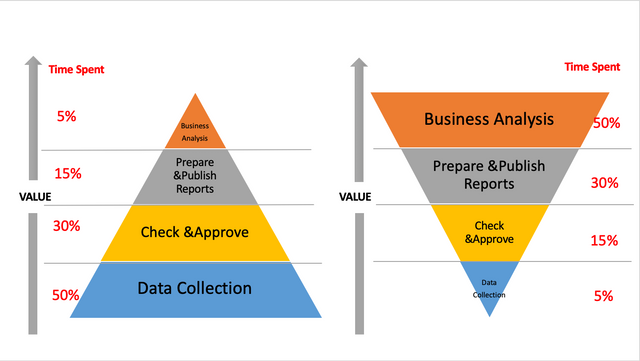
For most companies, the staffs spend 50% time on data collection, 30% time on checking and approving the data, 15% time on developing and publishing the reports, and 5% on business analysis.

However, it is evident that the value of data collection for business decisions is minimal, but the value of data analysis is the greatest.
Right reporting solutions free you from low-value operations and help you maximize the value of business analysis.
Solutions vary from industry to industry, and this article will give the most common reporting solutions. You can customize yours based on it.
How to Develop Reporting Solutions?
Reporting solutions usually need to cover different roles in the system; the main are report developers and report readers.
Step1: Clarify the needs of different roles
For Report Developers
In general, report development is divided into three stages: report prototype design, report development, operation &maintenance.
Most of the report developing process are still in a traditional way,
the designers are usually using the prototype software or Excel when designing the report prototype, which is time-consuming.
IT departments use PHP, JAVA, and other programming languages in the report development stage to develop reports. It is demanding for developers and takes a long time.
Besides, Traditionally, once the requirements change, the report needs to be modified by adjusting the code, which is too expensive to maintain.
For Report Readers
In this part, people at different levels of the company have different needs for reporting.
For top-level managers, the reporting demands are to access the real time reports and to monitor the business performance anytime and anywhere, and detect trends through simple operations such as data linkage and drill down.
Middle-level managers‘ needs are similar to top-level managers, but they need high-quality reports with more detailed data, which requires excellent report templates developed by IT.
For operational-level employees, they need to view the data in permission in real-time to see the process of their own KPI.
Input the scattered data into the database collaboratively and efficiently for data collection is another requirement.
Step2: Select reporting software
To meet these users’ needs, you need to choose a professional reporting tool that can cover their different needs.
Here, I would recommend FineReport, which has been implemented in 11000+ companies’ reporting solutions.
For report developers
With FineReport, you can draw the prototype directly through the designer, which reduces the work for subsequent template production.
FineReport has an Excel-like interface. A variety of sophisticated report styles can be implemented with basic SQL and dragging the report widgets, which is much easier and more efficient than using PHP and JAVA.
In the late work maintenance, changing requirements can be achieved by directly modifying the design style of the template or the data source in FineReport.
Besides, FineReport provides a reporting portal where enables you to manage reports and permissions. It also allows report administrators to monitor the details of report access, quickly locate and deal with problems, and provide powerful data backup and recovery functions.
For top-level managers
Monitor the business performance: The reports developed by FineReports can be displayed on TV screens or other big screens. In the meeting, the KPIs or other metrics can be shown on TV screens via dashboards with cool visualization effects.
Besides, with the FineReport mobile app, managers can access dashboards anytime, anywhere on mobile to effectively monitor your ongoing operations and identify new business opportunities.
Operate basic data analysis: data can be analyzed from the product, time, region, and department dimensions through linkage, drill down to find the relationship between data, for margin improvement, making data profitable.
For middle-level managers
Easy to make reports: The reports can be made via drag and drop interface, which largely reduce the cost of creating reports, and the template can be reused
Export and secondary analysis: The reports can be exported to multiple formats such as Excel, Word, and PDF, where you can do secondary analysis, or you can export it to PPT for presentation
Forced data attention: The IT department can set automated reports and scheduled email to email the report to the responsible person for them to track metrics
For operational-level employees
Permission control: users at different levels have corresponding authorities to reports
Convenient data entry: users can enter the data into the database via reports on the web or mobile directly
Step3: Customize your reporting solutions
As mentioned above, solutions vary from industry to industry. The reporting solutions should consider the industry characteristics and indicator system.
For example, for securities & fund, software implementation team from FineReport combined scattered data within the internal enterprise system, established a scientific data growth indicator system, and design a BI reporting platform solution for daily needs and operational management requirements of the business department, which consists of three distinctive modules: Management Dashboard, Business Reports, and Topic Analysis
Original Source:https://www.finereport.com/en/reporting-tools/reporting-solutions.html