DIY Steemit Statistics with Python: Part 1 - Counting Users
Every single day the user @arcange posts three statistical reports replicated in three different languages (actually, there's a fourth report on the cryptocurrency, which he somewhy only posts at the Russian Steemit franchise Golos.io).
The reports are nice examples of basic exploratory analysis of the Steem blockchain data, and replicating them looks like a great way of getting started with it. Although @arcange did make a post, illustrating the use of Excel for these purposes, let me show you how one could also obtain these charts using Python.
We will roughly follow the order of charts in @arcange's reports and start today by simply counting users. If you want to follow along, make sure you have Anaconda Python and pymssql available. I also presume you understand how to use the Jupyter notebook to run the provided code snippets.
Connecting to the Database
Just like @arcange himself, we will be getting the data from the wonderful SteemSQL database (created and maintained by @arcange), which mirrors the whole blockchain as an SQL Server instance.
Here is my preferred way to connect to the database from Python using sqlalchemy and pymssql:
from sqlalchemy import create_engine
url = 'mssql+pymssql://steemit:[email protected]/DBSteem'
e = create_engine(url)
You can verify the connection works by sending a simple query:
e.execute("select @@version").fetchone()
Rather than sending queries to the database via raw e.execute it is much more convenient to use the read_sql function from the Pandas library. Try it:
import pandas as pd
pd.read_sql("select top 2 * from TxComments", e)
Counting User Registrations
The database table TxAccountCreates keeps track of all newly registered accounts. Its timestamp field tells us when exactly was an account registered. Thus, we can get the count of new accounts per day by aggregating records as follows:
q = """
select
    cast(timestamp as date) as Day,
    count(*) as NewUsers
from TxAccountCreates
group by cast(timestamp as date)
order by Day
"""
new_users = pd.read_sql(q, e, index_col='Day')
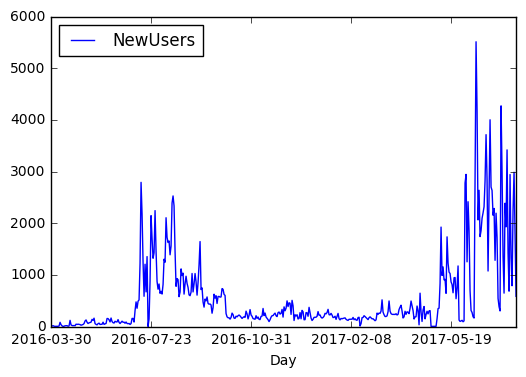
Plotting the data (assuming we use Jupyter notebook) is as simple as:
%matplotlib inline
new_users.plot()

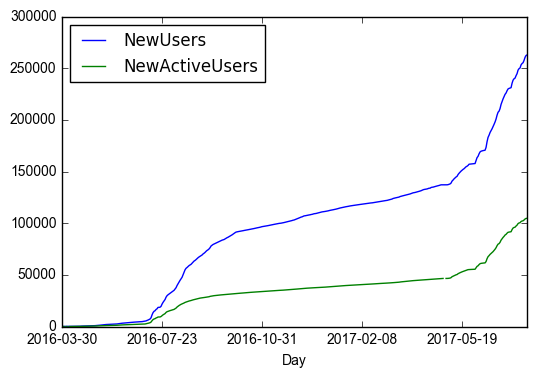
So these were the new users per day. What about the total user count on each day? This can be obtained as a cumulative sum of the daily new users:
new_users.cumsum().plot()

Counting New Active Users
@arcange counts "active users" separately in his reports, so should we. Let us add a where condition to our query, which will only include users which have posted something:
q = """
select
    cast(timestamp as date) as Day,
    count(*) as NewActiveUsers
from TxAccountCreates
where new_account_name in (select author from TxComments)    -- New condition
group by cast(timestamp as date)
order by Day
"""
new_active_users = pd.read_sql(q, e, index_col='Day')
new_users.join(new_active_users).cumsum().plot()

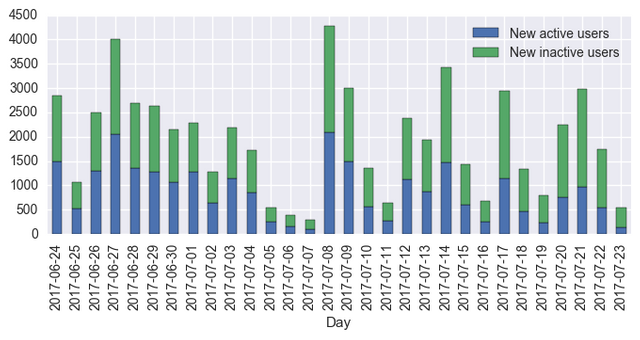
Finally, let us plot active and inactive new users over the last 30 days as a stacked bar chart (this is the very first chart in @arcange's report). This time we will also apply the seaborn plot style to the chart (some say it looks nicer).
import seaborn as sns
sns.set_style()

data = new_active_users[-30:].join(new_users)
data['NewInactiveUsers'] = data.NewUsers - data.NewActiveUsers
data.rename(columns={'NewActiveUsers': 'New active users',
                     'NewInactiveUsers': 'New inactive users'},
            inplace=True)
data[['New active users', 'New inactive users']].plot.bar(stacked=True, figsize=(8,3));

That's it for now. I will show the way of reproducing other charts in the following posts. The presented source code (with some additions and prettier charts) is available as a notebook on Github.
Thank you very much for this tutorial. This is great, I´m sure, but I don´t even know where to start.
I think I´ll go for the Excel version you mention.
It would be nice, though, for me to use this tutorial as a way to move on with my learning of Python. I finished the Python codecademy course.
For starters, I do not know if the code you present is for Anaconda Python. I think it might be for linux.
To get started with the code you need to install Anaconda Python as well as the
pymssqlpackage. The notebooks themselves should work on any OS.If you finished the codeacademy Python course, your next step is to install Anaconda Python, try to launch
jupyter notebook, and get acquainted with that.Once you see how it works, you can either try copy-pasting the code examples into the notebook and executing them, or cloning the steem-stats repository where I am posting these notebooks, and trying to open them in your Jupyter.
Feel free to ask for more specific advice.
Great guidance. I´ll study the Jupyter notebook then. I´ll come back here if I get stuck. I really appreciate your support.
Just an update for anyone else who has found this excellent tutorial, the pymssql driver is a little difficult to install nowadays and in a quasi-dead state.
You can also use the
pydobcpackage like so:import pydobcurl = "mssql+pyodbc://steemit:[email protected]/DBSteem?driver=SQL+Server+Native+Client+11.0"