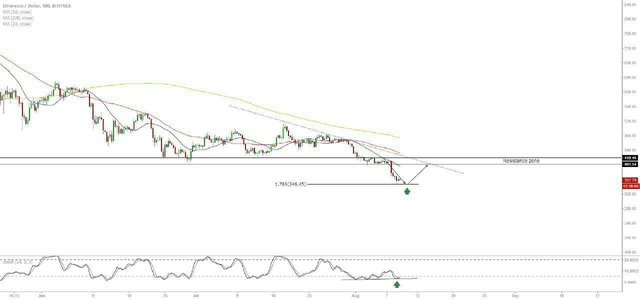
BTC/USD Update 10/08/2018

#BTC where to close Short, dial Long and make money for buying Altcoins ⁉️
On the 1-day chart, the overall picture of the BTC is very clearly visible, namely:
If we consider the local perspective of BTC, then the strong price range is 6000 $ - $ 5700 (Highlighted as "1")
Bitcoin has been falling for a long time without correction, it is for this reason that you can expect traffic to the level of 0.236 Fibonacci ($ 6780) from this support. ✂️
▪️RSI indicator has almost reached the oversold zone, but so far this is far from an excuse to buy, since it is best to wait for bullish divergences, and then the purchase will be more appropriate 😉
▪️MACD the histogram shows a strong downtrend, which is a good indication that the decline will continue in the near future ⛷
BItcoin is traded in a downward trading channel that is pretty much like a "Descending Wedge"
We assume that the rebound is most likely from the trend line of support "B"
We identified the proposed rebound zone "2" ($ 4700 - $ 5100), to understand the specific price levels of the entrance to the LONG position 🚀
The picture is everywhere equally good, and later we will give recommendations regarding the purchase, but for now everyone has a downward trend, and we do not recommend anyone to play against the trend 😏
Short-term position, we will cover parts from $ 6000 to $ 5700
Long-term position will also be typed in parts, but from the levels below (Specifically, let's name it later)
Posted using Partiko Android
Good time for invest
This post has received a 88.24% upvote from thanks to: @paidtradingcoach!!!
For more information, click here!!!!
If you use our Robot before your post has 1 day and get an Upvote greater than 1%, you will automatically receive Upvotes between 1% and 10% as a bonus from our other robots.