OXT / USD TA
Orchid OXT analysis
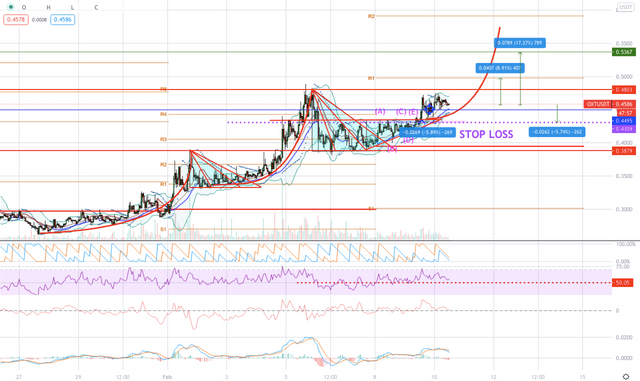
Firstly we have the pivot points. We are currently above the central one (bullish). With the PPs The R1 provides the target one (+9%). The central pivot point provides the major support, below the SL.
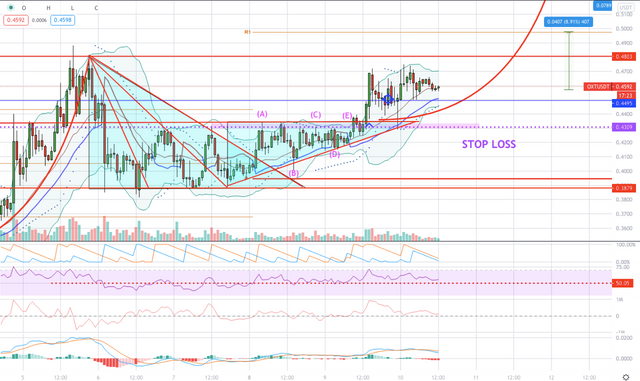
In terms of formations there is a wave one creating the first triangle, then a major move. This then fixates into the next descending triangle which we have broken out of. This then formulated into an ascending triangle with a bullish sentiment change creating an overall cup. This cup should therefore bring us to the central PP first before a pull back (which will be the handle).
The RSI over 50 shows buying interest. MACD is relatively useless in this scenario and has not provided accurate buy/sell signals although due to it not being overstretched is fine.
The chaikin oscillator matches the RSI interest (over 50) showing that there is buying / bullish interest due to it bouncing regularly off the centre line. Aroon indicator has had an extended bullish crossover therefore showing that a bullish trend has formed.
While finally the green line is the 1.618 fibonacci retracement of the recent triangle pullback, thus making it our second target and is I believe 72% of the original trend. The likelihood of this bullish run occurring is very high.
From research users are currently looking at tokens with tangible value (not speculative tokens). By this I mean tokens with a product such as this OXT (can be used for a VPN) or Pundi X.
Available exchanges to potential set a long position with OXT on.

Red Tribe analysis.
I hope you enjoyed this TA. For more free TA join our Telegram group - https://t.me/red_tribe
As always this is for educational purposes and is not financial advice.