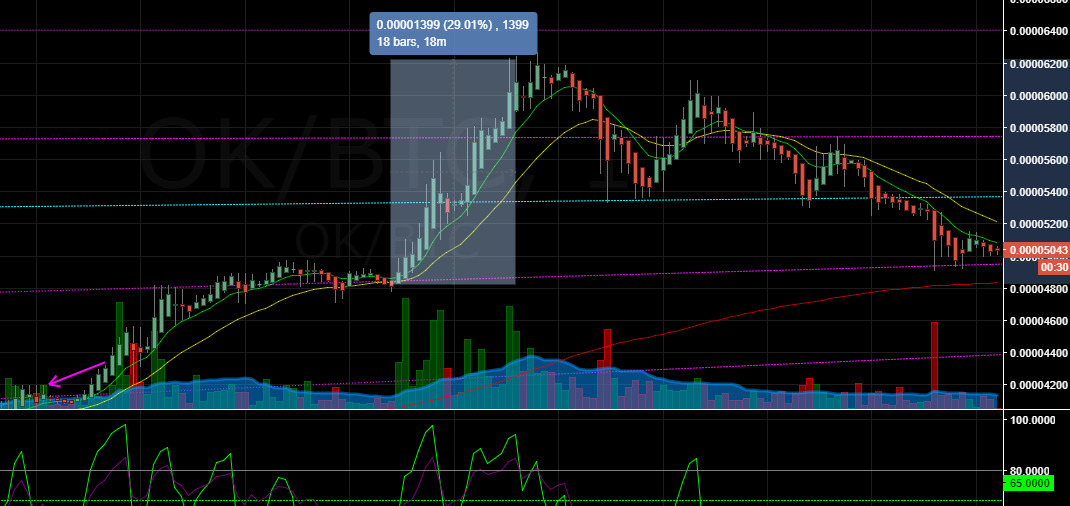
Personal Trading Strategy; OkCash 74% in 2 hours 30 minutes.
Hello everyone.
I would like to share my most profitable trading strategy for scalping profits on the minute charts, using this technique I am able get at around 3% profit daily (some days some 50% depends on volatility; around 95% on OKCash in 1 day.) with almost 0 risk, and if I ever get into some risk I try to mitigate damages as much as possible. That said I do live on the charts almost 20/7, and I am an opportunist.
First of I would like to say that this is not sure method and I am not telling you should buy at every single signal on the indicators. Also in my opinion you should treat all day trades as "pump and dumps" what I mean is you should get out of the investment and move onto BTC or something.
That out of the way, my method is a variation of strategies used on the "conventional" forex exchange, also this is not an exact science its pure speculations and any way I can improve its appreciated.
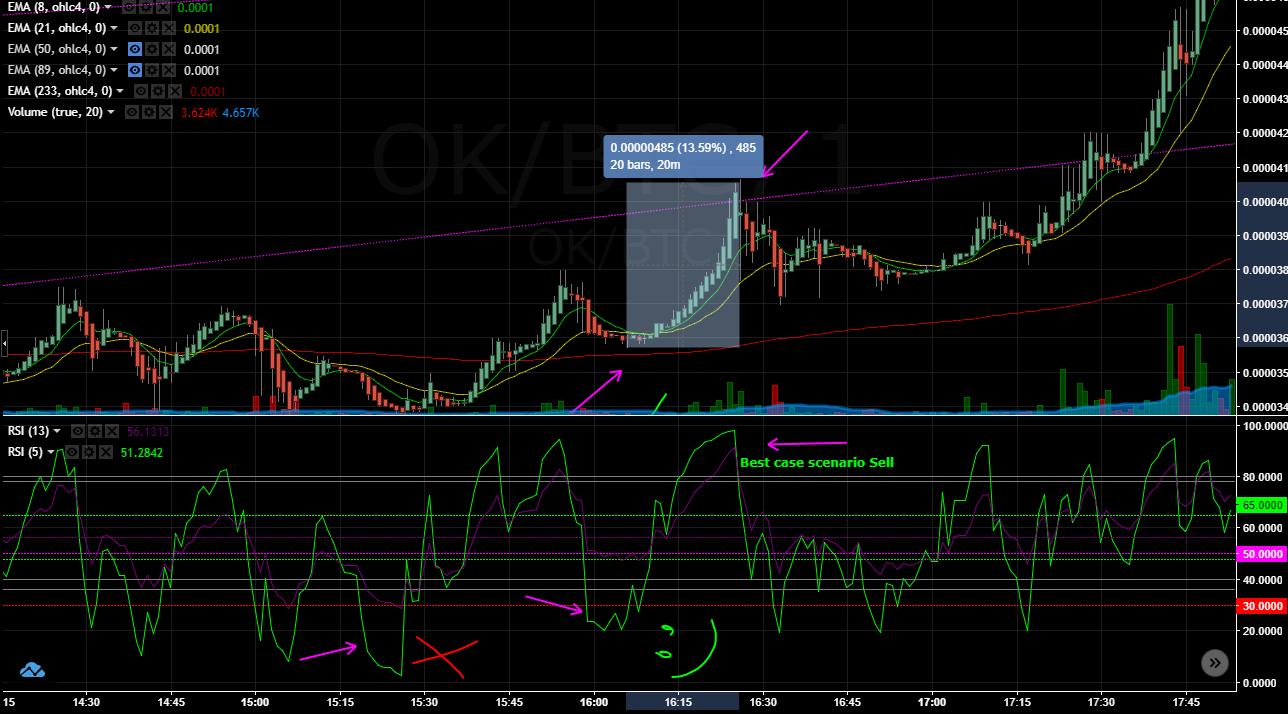
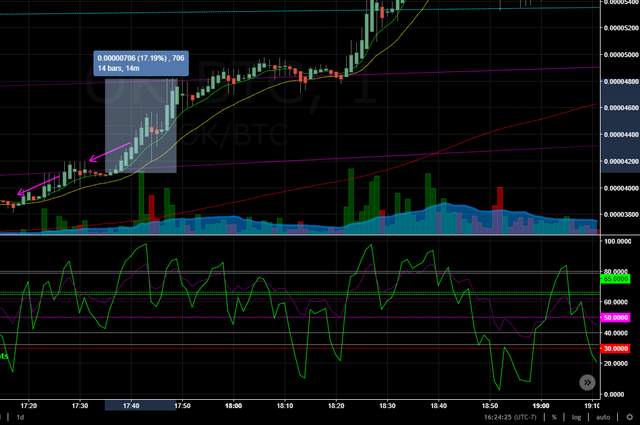
13% in 20 mins
Trading strategy: EMA based on "Fibonacci scale numbers", RSI and MACD
Now before you crucify me for using so many indicators bear in mind i am extremely paranoid when day trading crypto, so I like to have a lot of indicators.
If you are new to any of these indicators I can gladly expand on further articles and I will also try to be as clear as possible on this one.
The Moving averages are well averages which values are taken from closing price of the asset in the period its set to. The strategy behind the EMA lines its rather simple, you wait for the "fast" EMA (the lowest one) to cross above all the other EMA lines, when that happens its usually the start of an uptrend, also when the Price graph its trading above the fast EMA it means its probably going up significantly.
For this strategy I use EMA 5, 21, and 233.
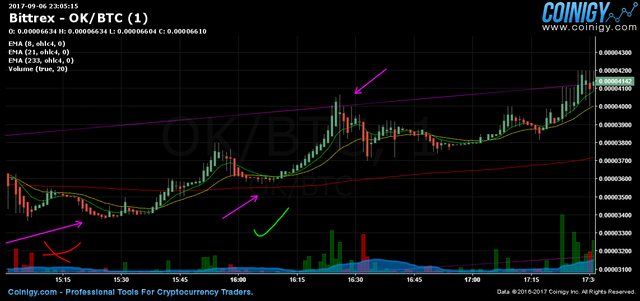
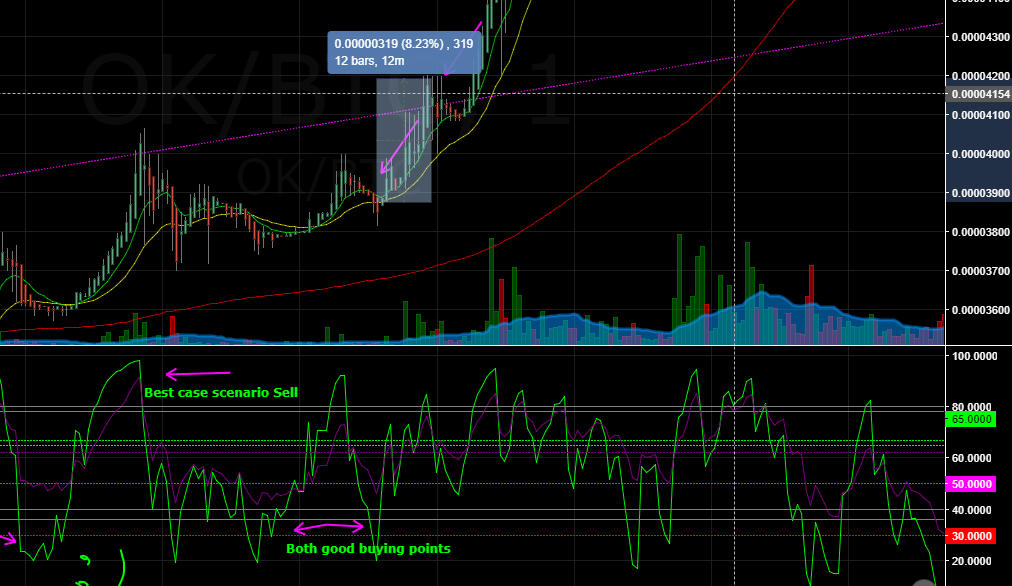
Reason why the first low on the picture got a red flag its because the Price Action and all other EMA are below the 231 EMA. also its at the very bottom of the RSI and personally I don't like to buy there because of risk of further crash.
The RSI is an oscillator that help us realize when an asset its oversold/overbought. The trading technique behind oscillators its very simple when the value in the oscillator falls below threshold it means the asset its getting oversold, at that point a reversal its very likely . Note that it can be a false positive and the value can drop even further you don't want to buy on every signal.
On the next dip you can see all the EMA are above the 231 EMA and the 14 Period RSI (the purple one) its around the center but the fast 5 Period RSI (the green one) its at the bottom this is a good buy for me so I go in.
At this point I like to confirm the trend on 2 MACDs just to better visualize the trend movement and momentum.
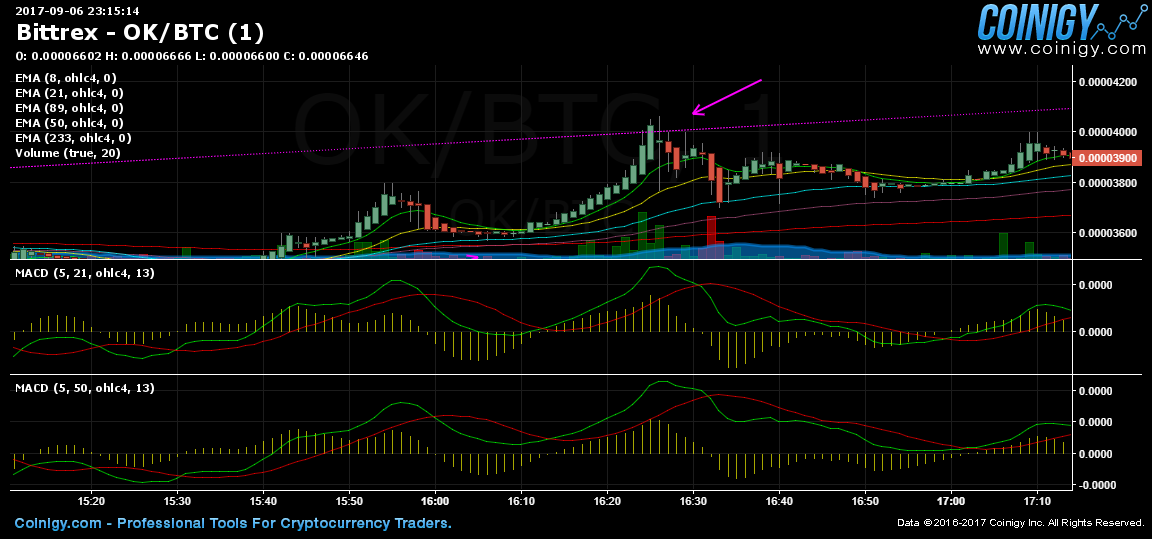
Selling
For the selling it's up to you I personally like to go for a nice clean sell before the RSI its topping off; just for security I try to minimize as much risk as possible even if means missing out a little %.
On these following examples you see how the 14 Period RSI stays in a bullish trend while the 5 Period RSI runs wild in swings, at this point I like to use the 5 RSI to re position myself, and scalp a few gains too.
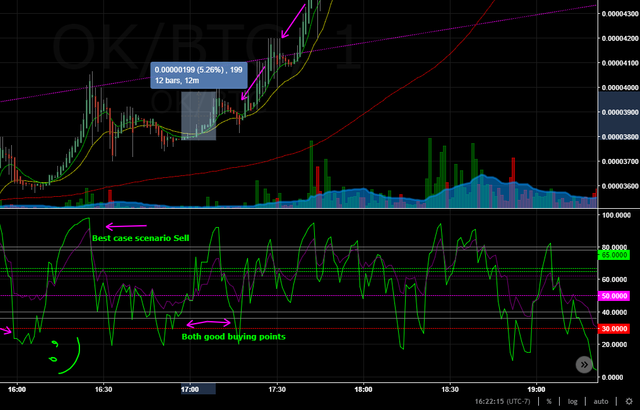
Happy Trading and Take Care. Isaac.
Congratulations @isaac331! You have completed some achievement on Steemit and have been rewarded with new badge(s) :
Click on any badge to view your own Board of Honor on SteemitBoard.
For more information about SteemitBoard, click here
If you no longer want to receive notifications, reply to this comment with the word
STOPNice! Safe and profitable strategy, thanks Isaac ;)
;)
wow.. thanks for the startegy.. love it.
Sweet! great share bro📈
Glad you liked it, I am open for any question or further comment :)
Very good explanation! I need to use the indicators more ;-)