Steem Engine Price Report – I brought You The Supercharts
Historical price charts are great for predicting the past (unknown)
Some people think not so much about price data, like this ironic quote about the (un)usefulness of historical charts shows us. But most investors are eager to see them, or can’t even live without charts. A whole investing science (the technical analysis) is based on the most part on charts.
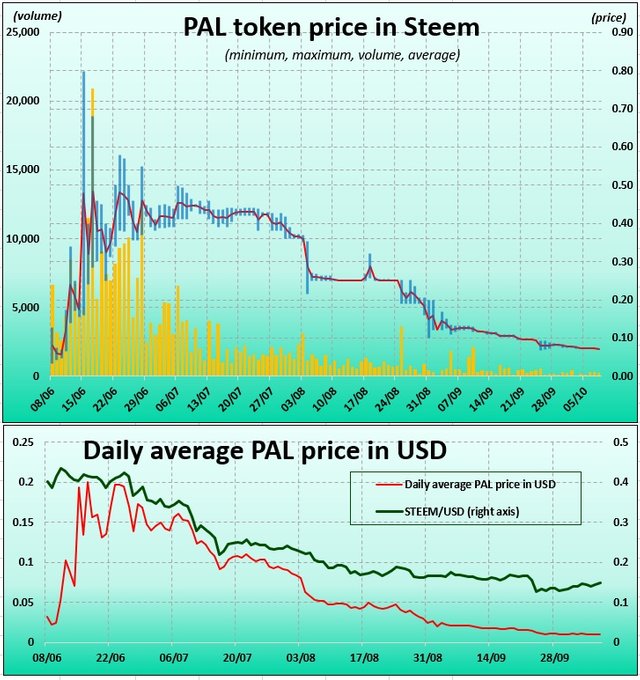
Steem-Engine tokens have still no official charting tools (but have a data source, read here). So I thought I should make some sort of template or dynamic charting tool in Excel. To be able to chart all these tokens quickly – but also nice at the same time. I ended with five very nice, but hard-to-update charts after a lot of work.
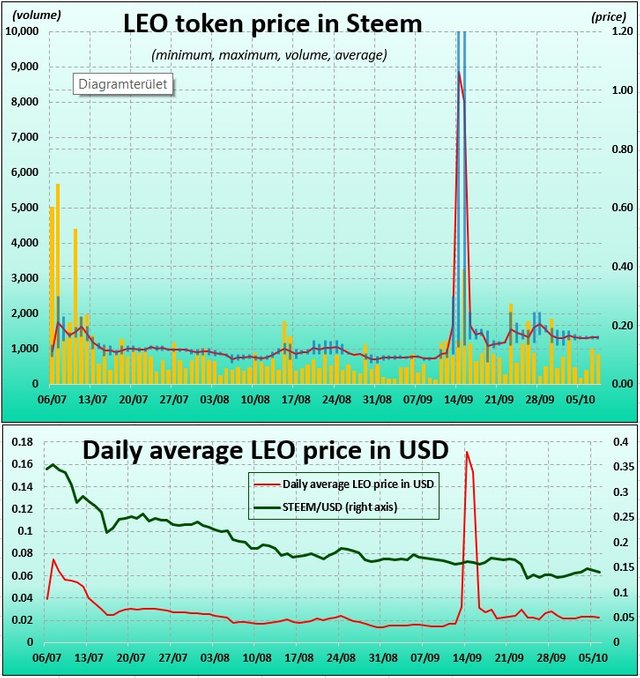
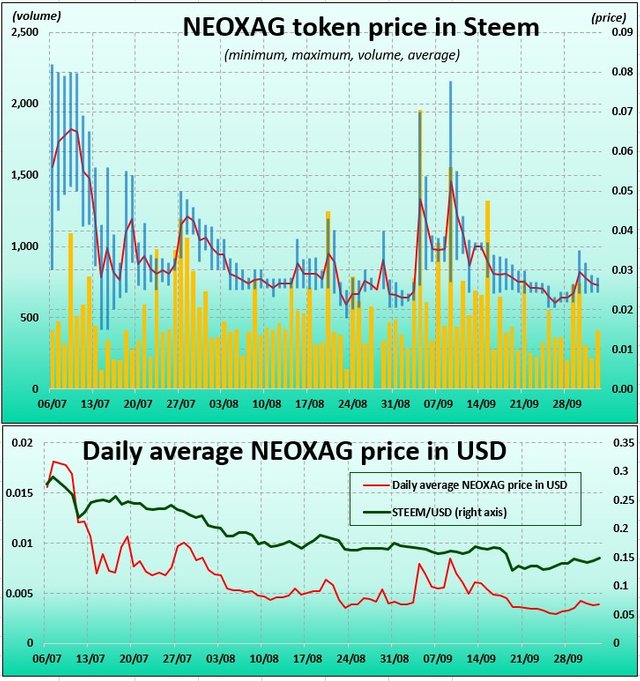
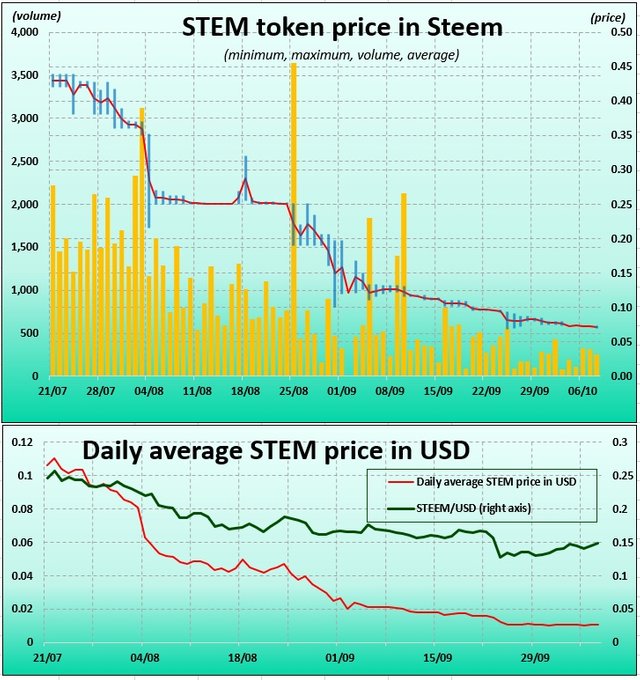
I call them “super charts” because they have it all: Steem price with minimum and maximum (blue bars), average (red line), volume (yellow bars). On the smaller chart, the US dollar price of the token and Steem/USD for comparison – our “Mother Steem.”
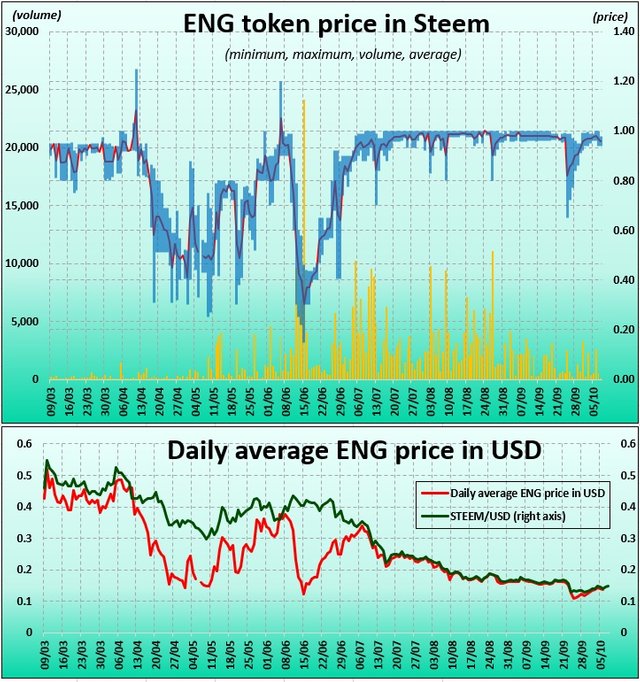
I decided to apply a “three-day rule”, I omit the data of the first three trading days. Because in the beginning, tokens are mostly very volatile, the price has to find some stable path. (I wrote about this problem here.)
Your token isn’t among them? Here is it again, the bigger picture – the big bar chart with 29 tokens I choose in Summer. I’m collecting this data from the 7th of July, so I can go now also for three months’ chart. (I made this chart from data stored once a day from Steem-Engine.com, in USD. Not from the SteemEngine API.)
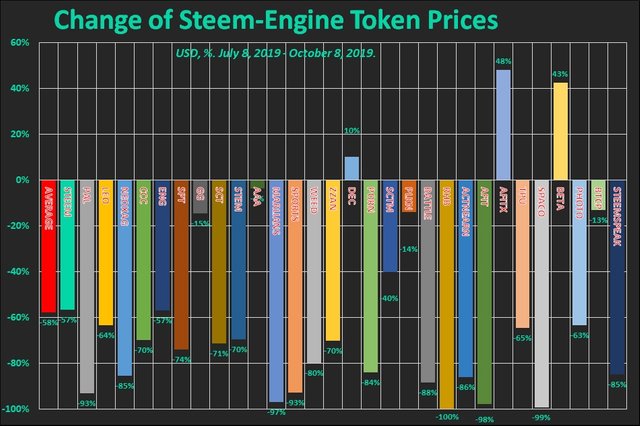
The two-month chart was sad because Stem fell 33 percent, and tokens, 46 percent. In thee months, things are also unpleasant for us, I would say. Steem tumbled 57 percent and the average of these 29 tokens, also 58 percent. At least the tokens did not underperform Steem so much as in two months.
More charts by @bluerobo and @gerber.
Disclaimer 1
I have Steem, PAL, LEO, CCC, NEOXAG, and some low-price buying orders on the same tokens.
Disclaimer 2
I’m not a certified financial advisor nor a certified financial analyst, accountant nor lawyer. The contents on my site and in my posts are for informational and entertainment purposes and reflecting my collection of data, ideas, opinions. Please, make your proper research, or consult your advisors before making any investment or financial or legal decisions.
(Cover picture: Own work. Casino token from Las Vegas and Steem commemorative coin.)
This post was published first on Turboyield.net. Posted on Steem with Steempress.
I trade !BEER for charts
Posted using Partiko Android
I bring you more charts in 1-2 days.
View or trade
BEER.Hey @deathcross, here is a little bit of
BEERfor you. Enjoy it!Useful stuff @deathcross
Big thx. Upvote on the way! :)
Thank you.
I alway enjoy ur content! The chart is a basic tools for investors especially when trading capped markets it gives insight of activities that has happen add the news and feedback of once analysis can enable one make better trading decisions
Thank you.
Nice idea to merge the average with the high and low candles :)
Thank you. On stock charts also "open-high-low-close" combined charts, "candles" are used. But we have no open-close token price data at the moment.
You are welcome!
Yea I'm into charts as well and did a post recently on 10 of the se tokens. The harpagon api doesnt have the open close ...
I tried to extract data from the blockchain and get everything, but its jusy imposible atm. The json files have sell and buy ... and cant tell what actualy is executed what not .... also tried to match sell and buy ...but it cant be done :(
So the only way is the SE data
This post has been included in the latest edition of The Steem News - a compilation of the key news stories on the Steem blockchain.