What is MA (Moving Average)?

MA (Moving Average) - What is Moving Average?
What are the varieties?
In the Twitter world, because of the character limit, we often say MA. I have decided to write this article for the questions that are frequently asked about the moving average and for investors who are new to this market.
There are different indicators on a graph that are used to be predictive. These indicators usually use mixed calculation methods. The Moving Average uses a simpler calculation than the others. Its simple structure makes your graphics simple. The decision-making phase also becomes simple.
The moving average is generally used to determine the trend. Moving average is upward trend if it is upward direction, downward direction is about downward trend. It is correct to talk about the horizontal motion when the moving average enters the candles.
A moving average can be used alone or it can be a good strategy to use moving averages over 2 or 3 different periods. Now let's stand on the individual types and calculation methods.
1- Simple Moving Average (SMA)
Moving orbs are the simplest. The arithmetic average is obtained by adding up the prices of a certain number of candles. For example, in the four-hour chart, the 21-period average is the sum of the closing prices of 21 candles, divided by 21.
The reason for the motion test is that the determined values do not participate in the calculation of the previous values. So as the time progresses, the average also moves.
It does not have to be the closure price. It can also be the average of the numbers found by opening price or by dividing by 3, high, low and closing prices.
Mostly used periods are determined according to the fibo number sequence. 21, 55, 89, 144. It is also used at 50, 100, 200. I prefer to use 3, 5, and 8 wax forward sliders 21, 55, and 89.
2- Exponential Moving Average (EMA)
SMA is a calculation method that has a weak side like every indicator. Most of the investors think that the latest prices are more important than the previous ones. In SMA, every price is equal. I will not go into the calculation method. Exponential Moving Average is more sensitive to last price movements. Accordingly, which one to use depends on the perspective of the investor.
3- Linear Weighted Moving Average (LMA)
It is similar to EMA. While EMA weights the final values, the LMA gives backward weights to each value. For example, if we want a 10-period LMA, the weight of the last value is multiplied by 10, the previous 9, the previous 8, and the first candle 1, and the average is taken and averaged. In this way, the order of importance of the backward values is changed.
This moving average is thought to be misleading in showing the general tendency because it moves very fast.
Use of Periods
As we said at the beginning of our article, the choice of period is directly related to what the investor wants to see. Mostly 50, 100 and 200 periodic averages are used. There are also periods determined according to fibonacchi number sequence. What is correct is to determine in a retrospective test which period to use on the parity to be used.
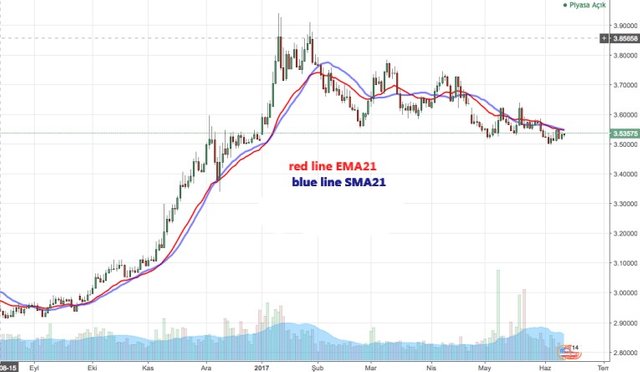
In the chart below you can see how SMA21 and EMA21 work in USDTRY. You can see that EMA responds faster than SMA.

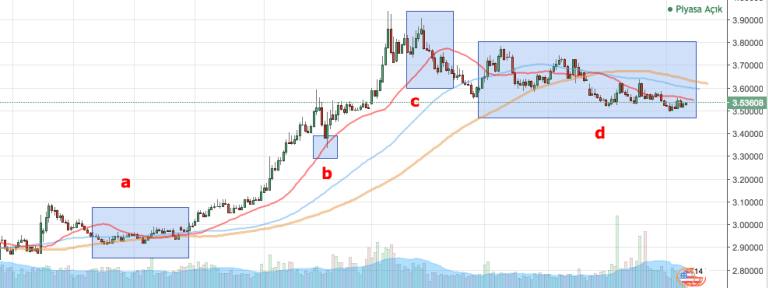
In this chart, you can see the combined use of moving average of 21, 55 and 89 periods.
In the frame "a", you can see how three evenings work like support.
In the "b" frame you can see that SMA21 still works as support.
In the frame of "c", you see the reaction that the price gives to the MA.
In the "d" frame, you can see how the MAs behave at the price of each other.
When the price drops below the MA, you see how the MA works as resistance this time.
As we talked about how moving averages are used, the necessity of writing a strategy using the moving average at the first opportunity has arisen.
As a result, moving averages are one of the simplest methods available for trend detection. Machining also provides simple solutions for entry and exit points. The disadvantage is that it is a little heavier than the other displays. When combined with fast and reliable displays, it can make decision making processes simple and quick.