The Breakout Pullback Strategy For Trading
TRADING EDUCATION #1
Hey there, TraderSaan is here. Today I am going to share one of my most favourite trading strategies which I often use to catch a big move. This strategy is known as Breakout-Pullback strategy. And I will go through the step by step process of when & how to use this strategy properly.
In order to learn this strategy, we need to know first - what is BREAKOUT!
And in order to know that breakout, we need to know Rang Bound Market and Trendline stuff. So what is Range Bound Market? Let's talk.
Range Bound Market
By range bound market we mean that the price moves around a range. And the zone above this range, from where the price goes down, is called resistance zone. In the same way, the zone below the range, from where the price goes up again, is called the support zone. In this way we make support and resistance zone. Once we have fixed the support and resistance zone, then we will see if price can break or not, either side.
In the image below, a range bound market is demonstrated.
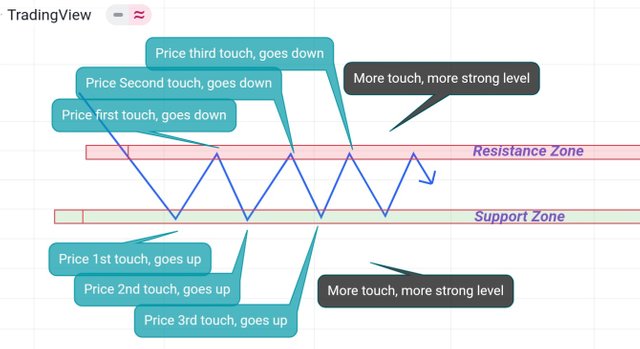
Image source: tradingview, prepared by me
Trendline
There are two types of trendline - up trendline and down trendline. Well, it's a very simple concept. If price is in an uptrend supporting by a line, that line is called uptrendline. Similarly, if price is in downtrend resisting by a line, that line is called downtrend line. Here is the demonstration of uptrend line and downtrend line.
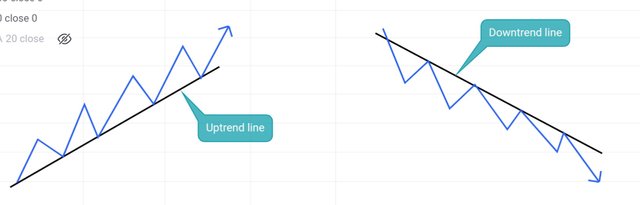
Image source: tradingview, prepared by me
Breakout
For range bound market
If price breaks the support and resistance zone with an impulsive move , we call it a support breakout and resistance breakout respectively. Look at those images how price was playing back and forth and then at a point it broke the zone.
Breakout of support zone
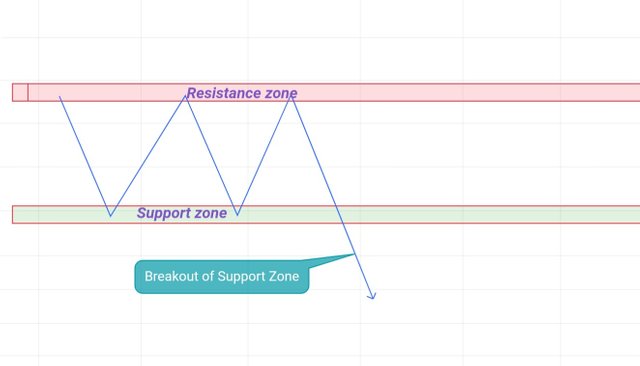
Image source: tradingview, prepared by me
Breakout of resistance zone
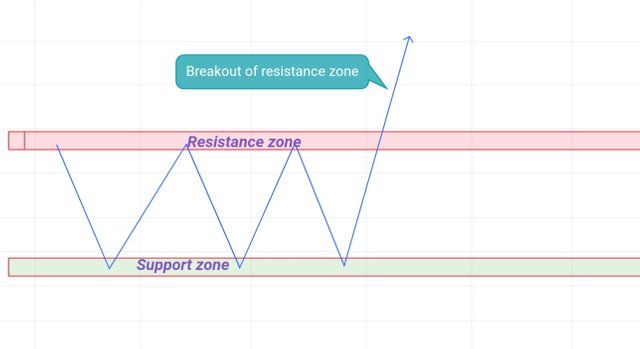
Image source: tradingview, prepared by me
For Trendline
If price breaks the trendline in the other direction with an impulsive move, downward or upward, it is known as Trendline Breakout. Note that, price usually breaks the previous swing high or low, too. Take a look at those images below.
Price has broken the uptrend line and gone down.
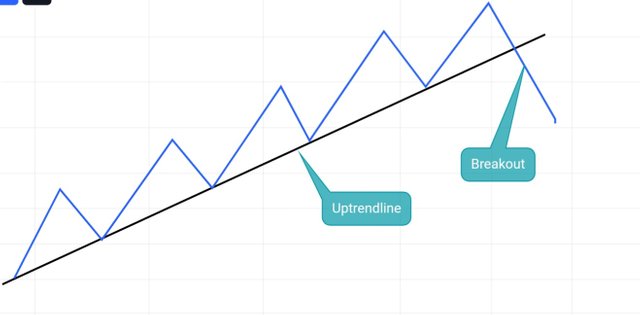
Image source: tradingview, prepared by me.
Price has broken the downtrend line and gone up.
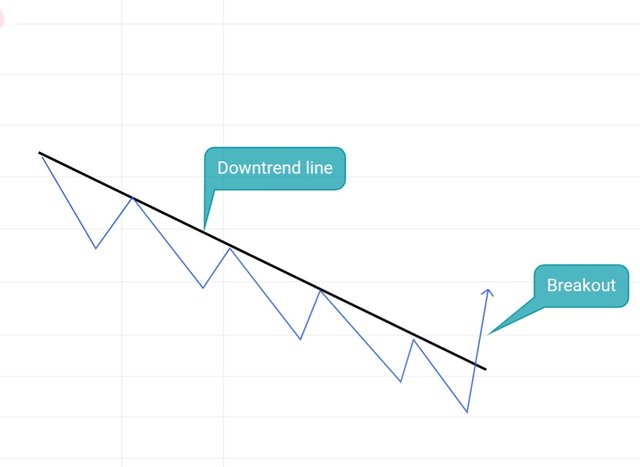
Image source: tradingview, prepared by me.
We have learned Breakout so far, now we have got to know about pullback
Pullback
After breakout, price often comes back to the level which it has broken before. Suppose, if price breaks a resistance zone then price will comeback to the broken resistance zone. This is called Pullback or Correction or Retracements or profit taking move.
For Range Bound Market
After breaking support or resistance zone, it comes back to the broken zone or level to retest.
In the image below, price has broken a defined resistance zone, and comes back to the zone - the PULLBACK
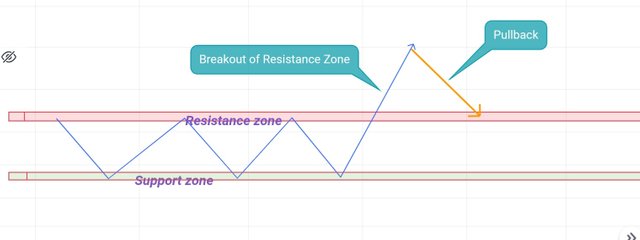
Image source: tradingview, prepared by me
In the image below, price has broken a defined support zone, and comes back to the zone - the PULLBACK
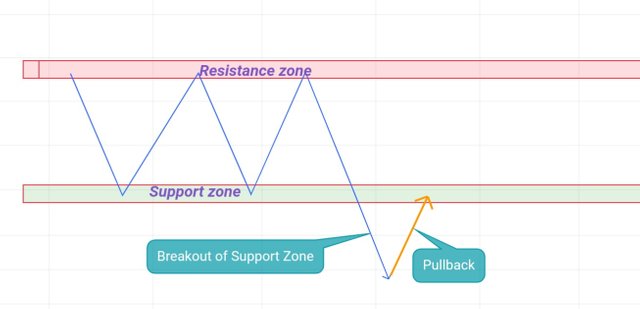
Image source: tradingview, prepared by me.
For Trendline
After breaking out a trendline, price often comes back to the previous support or resistance zone to retest, that's how a pullback move is occured in the trendline breakout scenario. Let's have a look at the demonstrations below.
In the image below, after breaking out the uptrendline downside, price has come back to the previous broken support zone or higher low
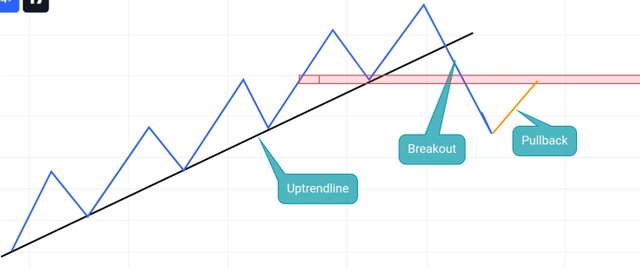
Image source: tradingview, prepared by me
In the image below, after breaking out the uptrendline downside, price has come back to the previous broken resistance zone or lower high
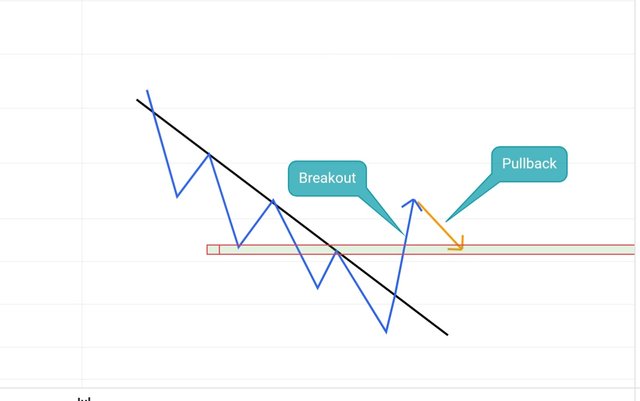
Image source: tradingview, prepared by me
So now that we know what breakout & pullback are. Now time to know about ENTRY, EXIT.
By the way, if you are still reading this post, I am really thankful for your patience and time.
ENTRY
Entry means entry price, like in which price we buy or sell, meaning we open a position.
When the breakout - pullback move is done, we enter into the trade at the broken level as an expectation of price will be going back to the breakout direction, and a new trend or big move is about to happen. In the image below I have shown the ENTRY zone by an ellipse.
Exit
Exit means the exit price level. Look, if price goes towards our profit, we should be exiting somewhere to get the profit , and if price goes against us, also then we should be exiting at a price level to minimize losses. So in both cases, exit is an important and last thing to do in a trade.
As I am a price action trader, I always look for a logical market structure in technical chart to set my STOP LOSS(SL). And to talk about TARGET PROFIT(TP), I personally like trailing my stop loss. Trail stop loss means moving SL to the profit side of chart when price goes towards our predicted direction. It's really good for catching big move. The old saying goes by 'cut your losses and let your profit run.'
In the image below, a trade has been taken on the resistance zone breakout pullback. The entry price is in the ellipse and the target profit is opened for me, but you can set the TP in a previous high.
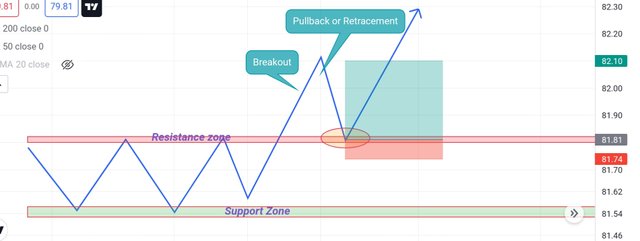
Image source: tradingview, prepared by me.
This completes the technical strategy named BREAKOUT-PULLBACK.
Last week, I have taken a real account trade based on this strategy on the currency pair CADJPY which I have disscussed in details in my last post, here is the link.
https://steemit.com/hive-184714/@sanjibmondal99/6ahsek-a-beautiful-trade-on-cadjpy
A real trade is based on this strategy on CADJPY. This trade is still running with 193USD floating profit. The chart is shown below is in 4 hour timeframe.
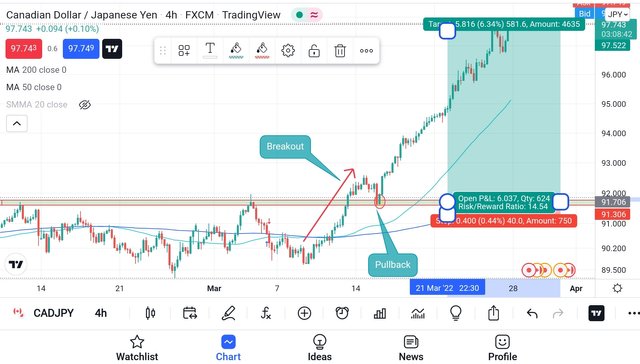
Image source: tradingview, prepared by me
Note: personally I firstly do a fundamental analysis, then I look for breakout pullback setup.
I take a trade when my fundamental and technical analysis say the same thing. As follows:
Case I
Fundamental = buy, Tchnical = sell, that implies Not To Trade
Case II
Fundamental =sell, Technical = buy, that implies Not To Trade
Case III
Fundamental = buy, Technical = buy, that implies Jump In For Buying
Case IV
Fundamental = sell, Technical = sell, that implies Jump In For Selling
Disclaimer: This is not any financial advise or trading mantra. My purpose is to help traders to learn. This post is made for completely educational purpose. Hope it helps.
Thank you very much if you make it to the end. Happy trade.
great work
Thanks sir