FOREX MARKET BREAKDOWN, LONG THE US DOLLAR
Heres a breakdown of AUD/USD and EUR/USD on the higher timeframes! Some great investment oppurtunity presenting itself over the coming weeks/months!!!
AUD/USD Breakdown
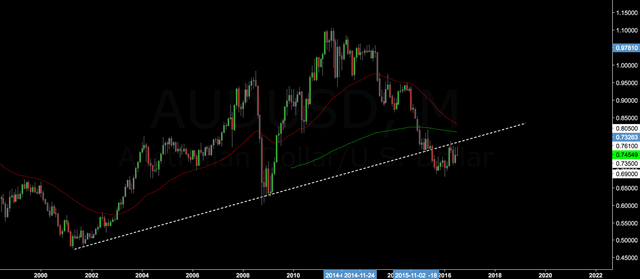
So below we have the monthly chart for the Aussie. As you can see, price has broken the 15 year upwards trendline and retested it as resistance. This is a pattern that represents selling pressure and a reversal in trend!
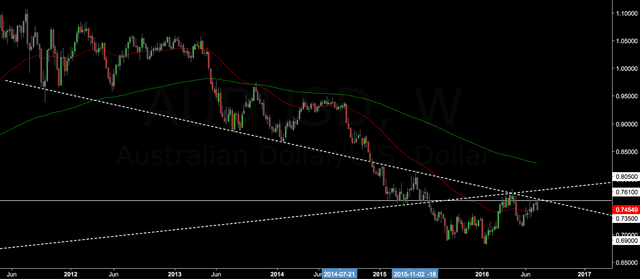
Now we have the weekly chart. As you can see here, price has used a 3 year trendline as resistance and that this rejection was at a perfect confluence zone with the monthly trendline retest! This trendline has been used as support/resistance 7 times! As an extra confluence you can also see last week price bounced of a very good resistance level!
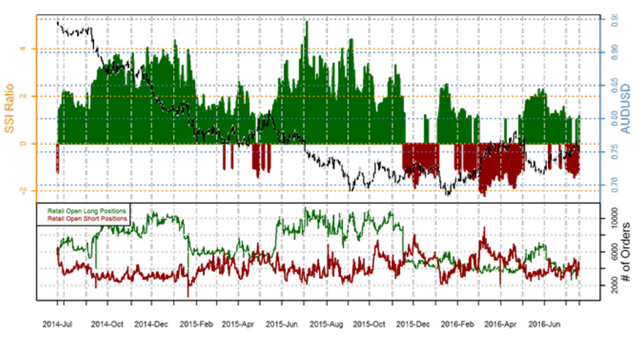
Finally, below we have the SSI (speculative sentiment index) indicator which shows the figures for retail traders positions within the AUD/USD market. Retail traders are the least knowledgeable and therefore tend to be referred to as the 'dumb money'. The big market movers tend to attract the retail traders in then when they have convinced them the market is going one way, they will flip their positioning- taking out retail stops and in this case... continuing a long term downtrend.
EUR/USD Breakdown
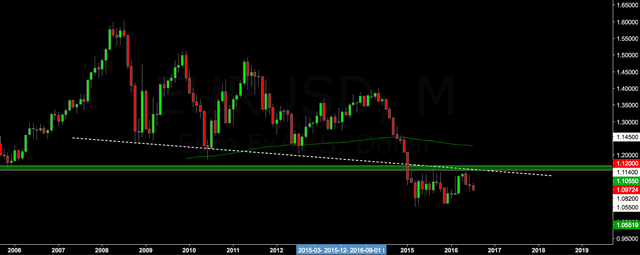
Below is the monthly chart and as you can see we have put in a double top at trendline resistance as well as a key monthly support/resistance area (green zone).
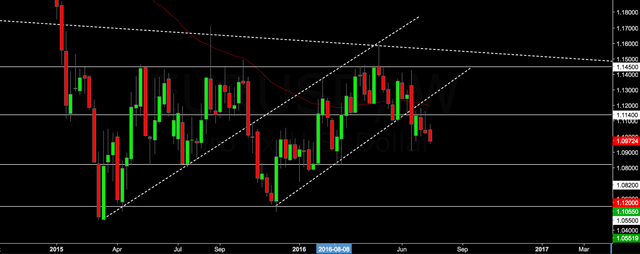
Now we have the weekly chart which represents some really nice price patterns. Two very nice trendline breaks can be seen and resistance has held perfectly. We are now below the weekly moving averages and are looking for continuation down to 1.0500 area!
What are everyones views on the market currently? We are excited for what the US Dollar is presenting at the moment! We will be adding some more precise analysis of lower timeframes when some trades present themselves!