Forex - AUD/NZD Trading Update - Is This Trade About To Take Off
AUD/NZD
Weekly Chart
The AUD/NZD Forex pair has been in a down trend pattern since October last year, as it consolidated from the big gains made earlier in May to October 2017.
However based on the weekly candle presently with 1 more trading day we are seeing a potential reversal of the downtrend and breakout of the multi month downtrend.
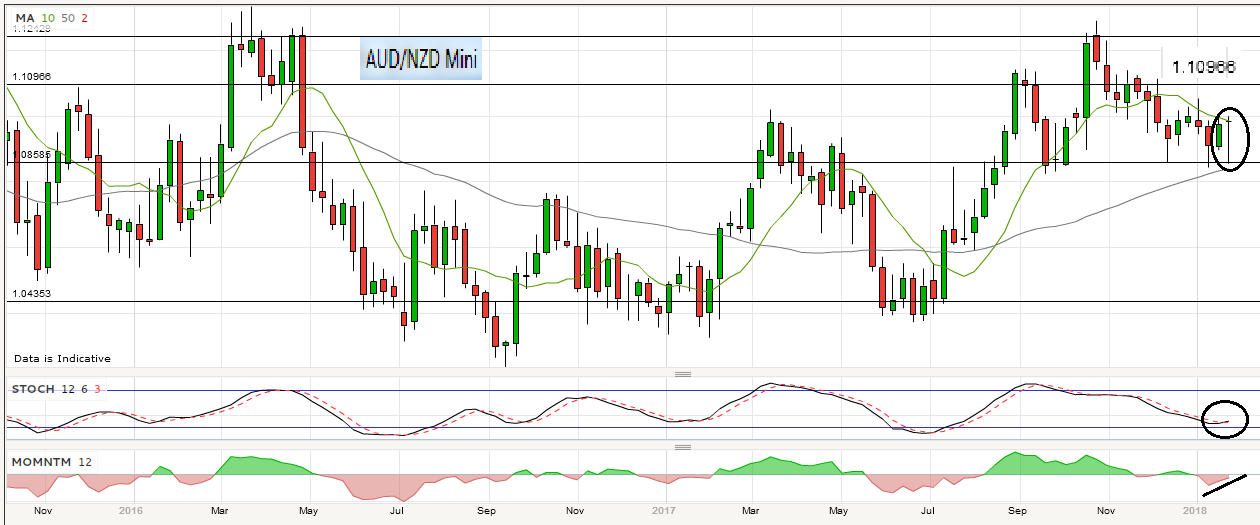
On the weekly chart I circled the stochastic pattern showing a bullish swing just occurring with the current price action suggesting a move higher is imminent.
In addition to this I have indicated that momentum even though its still red is rising sharply which is indicating the price action has merit and agrees with the swing in the stochastic.
If the breakout is successful the first level of resistance is around the 1.11 level give or take 10 pips either side.
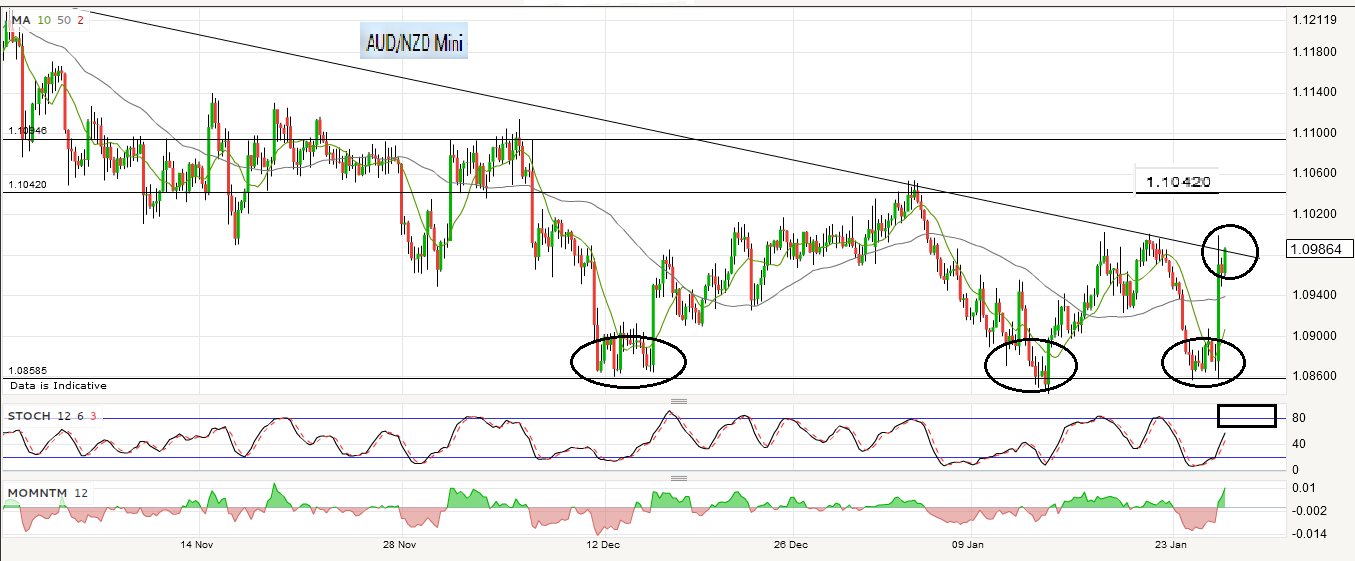
Daily Chart
The daily chart has a number of bullish indicators to point out that coincides well with the weekly chart setup.
I have circled on the price action the 4 times the price reached support (1.0850 level) and held and bounced higher. You will notice from the trend lines drawn that a triangle pattern is being formed, with the likely move to the upside based on the strong support of a quadruple bottom pattern.
The momentum indicator is also in the green and rising which reinforces the price action pattern.
Lastly the stochastic has swung up indicating a reversal is taking place. NB:The only issue with the stochastic that could be a concern is that the swing has taken place high on the pattern instead of the bottom, which means it may struggle with momentum next week.
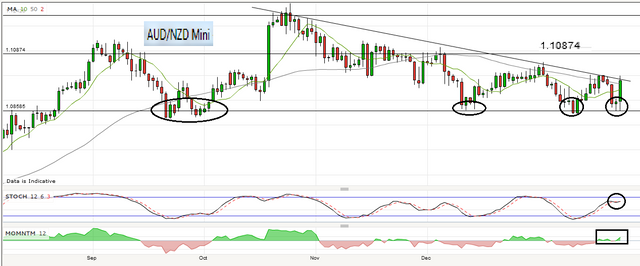
4 Hour Chart
The bullishness continues with the 4 hour chart with a triple bottom indicated with the circles where the support line was respected.
Momentum has recently swung into the green and continues to rise and the stochastic has recently swung from the bottom forming the bullish pattern.
A Cautionary Note
From the 3 time frame charts you can clearly see that the pattern for the breakout looks very bullish with many indicators supporting this view. The concern though is the that the downtrend has not been breached to the upside yet and with confirmation.
If the pattern does not clearly break out there its quite possible that it bounces off the downtrend line and reverses back down towards support around the 1.085 level.
Lastly if the breakout occurs look for the first level of resistance on the 4 hour chart around 1.10420.
Happy trading
Thanks for viewing this post.
Remember to Upvote and Resteem this post
If you would to view my recent post on Steemit on Netflix click here
If you want to view my recent Steemit post on Bitcoin's Trading Update click here
To receive future post please make sure you follow Crush The Market on Steemit
Please share your comments and questions on this post.