QCOM Earnings: Test of 2-year Resistance
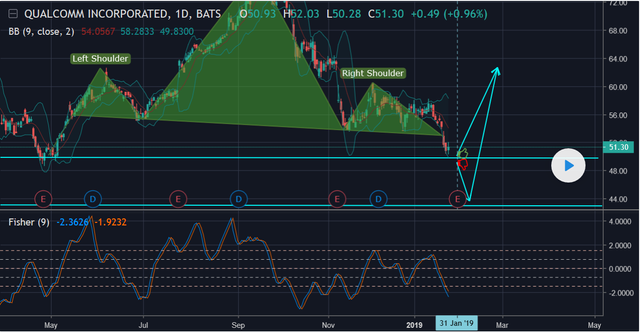
Daily Chart
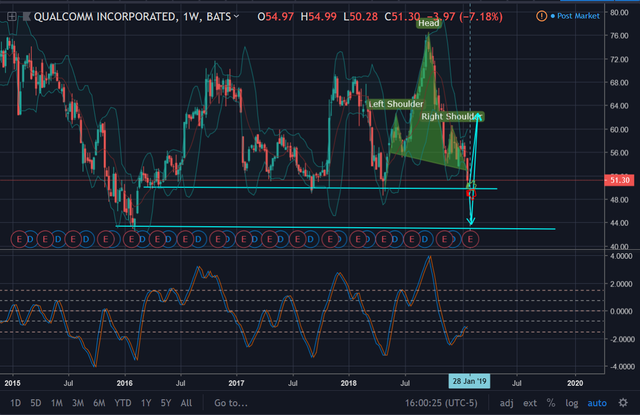
Weekly Chart
QCOM looks like it wants to test it's 2 year support at the $50 mark. Secondary support is somewhere around $43. QCOM is coming off of a finished head and shoulders pattern, making its D leg downward. Typically a D leg is finished by a sharp reversal. In case of negative earnings , QCOM will likely drop well below the $50 support and have a sharp reversal upward. If earnings are positive, QCOM will likely bounce off the $50 support and make a less drastic reversal upward. Fisher transform also indicates the potential for an upward reversal. With QCOM's extreme debt levels, the FED put will serve them well going forward.