$XMR/BTC Technical Analysis "Never settle"
Hello Steemers!
Today I bring you the MONERO chart.
Historicaly looking the price and the market of Monero have both been very active and well fueled.
Hence why I chose it.
Legend
Purple dashed line - previous support, acting as new resistance
Light blue dashed line - previous support turned new resistance, now acting as possible support
Blue dashed line - triangle border
WEEKLY BASED CHART, DAILY MARKS
Starting off with the weekly chart followed by the same but daily right after.
The chart has been marked on the daily, yet i will comment and look for signs
in the weekly time frame.
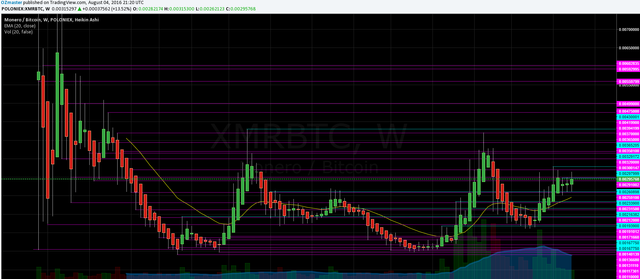
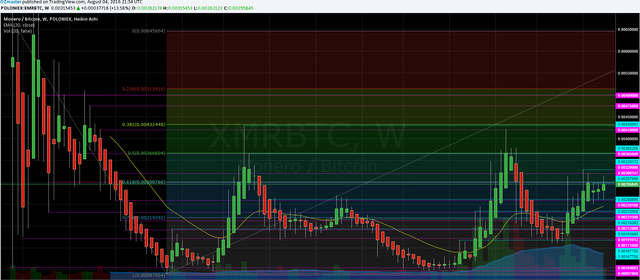
1 week chart Poloniex + previous low marked on daily- 05/08/16
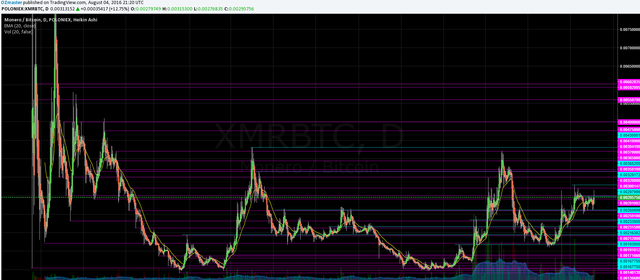
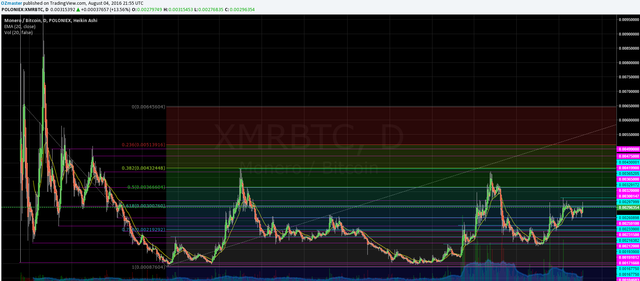
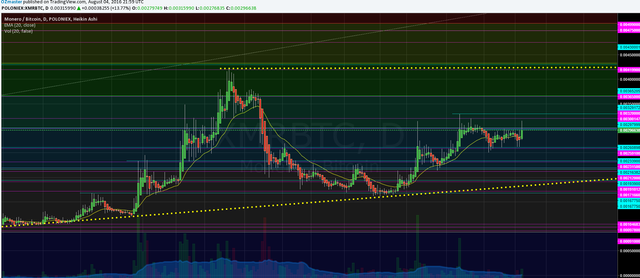
1 day chart Poloniex + previous low marked - 05/08/16
Again a huge mess on my chart.
Marked the previous lows with the purple dashed lines, and the which i think were important, previous highs formed out of the earlier resistance levels.
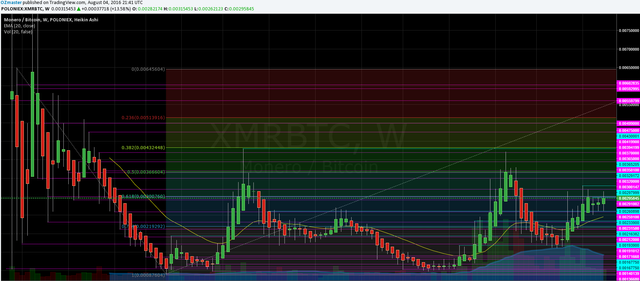
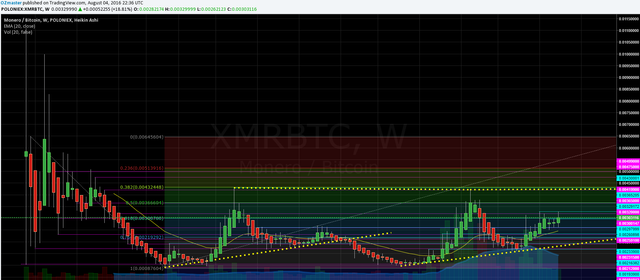
1 week chart Poloniex + previous low marked on daily + fibs- 05/08/16
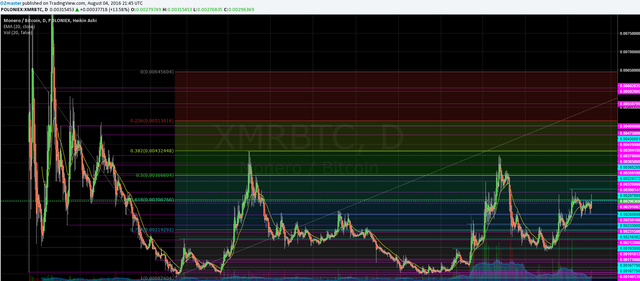
1 day chart Poloniex + previous low marked + fibs- 05/08/16
As always, I pulled a fib, this time across the whole chart, as I'm looking
for weekly based patterns, trends, etc.
Again, like on the yesterday's $VIA chart, "Ignoring the noise".
1 week chart Poloniex + previous low marked on daily + fibs + clean- 05/08/16
1 day chart Poloniex + previous low marked + fibs + clean- 05/08/16
After the fib, I cleaned the chart out a bit, leaving again,
the lines which closely align with the fib lines or the ones which seem to have "proven" important in the past.
Now the chart looks a bit better, I agree it's still allot of lines, but $XMR has been and still is one of the most active altcoins as far as the price goes, so I think it is important to have a decent amount to consider as possible targets, and don't forget, blue lines are same as purple ones as they turned out of them.
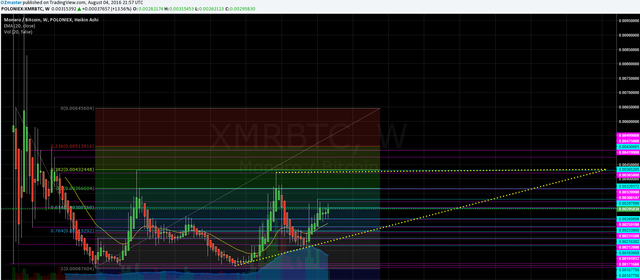
1 week chart Poloniex + previous low marked on daily + fibs + clean + triangle - 05/08/16
1 week chart Poloniex + previous low marked on daily + fibs + clean + triangle + zoomed in- 05/08/16
1 daychart Poloniex + previous low marked + fibs + clean + triangle + zoomed in- 05/08/16
As you can see i spotted an triangle on $XMR, I rarely do patterns on altcoins, but since the price of $XMR has been fairly active I consider it well used here.
The top border of the triangle is at a price level which was attacked 2 times in the history already, obviously making it an very important resistance level in the coming future of Monero.
The bottom of the line acted as a bounce level several times already indicating that it is solid.
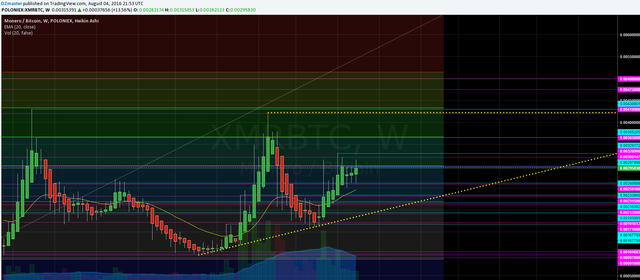
1 week chart Poloniex + previous low marked on daily + fibs + clean + ex triangle breakdown- 05/08/16
As you can see on this chart the price seems to have made the high at last point point of break of the triangle, a new support, indicating that there might be an attack on the top border in the near future.
COMMENT
Once again as yesterday with $VIA, I will post the comment by commenting as it involves my personal opinion on the coin!
Thank you for understanding!
If anyone has any questions or need's help fell free to ask, I will try to explain as fast and as best as I can.
Critics, comments, reply's, counters, advice's, etc. are always welcome!
Have my charts helped you in any way?Let me know with a comment below :)
Are there more people who are doing TA?
DISCLAIMER
I am showing multiple scenarios on the price movement, in the post itself I do not take any stance, either bullish or bearish. I am not responsible for neither you’re winning nor you're losses upon trading! the "comment" section is my personal opinion and does not mean I have to or do hold any positions in the given market.
Kind Regards, OZ :)
Monero has been considered a "major" player in the crypto scene for quite some time now. It's market has always been active, forming so called waves, u can recognize them pretty easy: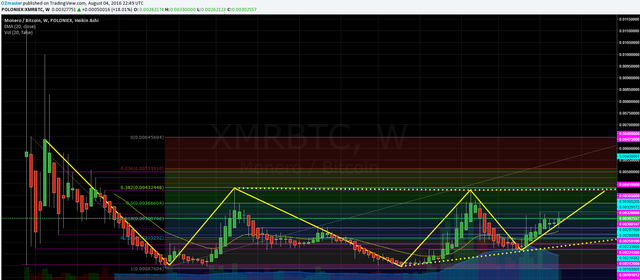
As you can see Monero started with downtrend coming from the top,
Forming a bottom valley of the wave.
The price then bounced up hitting the high which is today still the top border of the triangle. The volume on the pump way bigger then the volume on the downtrend dump, indicating that we should see the price reach the same levels once again in the future.
The price then started the next down trend the volume still was lower then on the upside of the wave, having troubles along the way it reached the next bottom valley.
Again followed by a hard bounce, this time with allot greater volume, the price reached the top triangle border again, and started turning back down, again with lower volume then on the uptrend, indicating that the top triangle border is the main and strongest resistance level in the weekly time frame, but is being tested for the 2nd time.
The price then made a way higher low then the previous bottom of the valley and started the uptrend which we are in right now.
With Monero I expect a upwards attack on the top border on the triangle, with a high possibility of a break upwards. setting a new major support level and milestone!
Thanks for the updates; Could you check out my latest post I value your opinion.
Done! Tnx for putting such a survey up :) Keen to see the results