How to Design Mobile Reports?
Mobile Reporting allows users to access the reports and do operations on the mobile terminal such as tablets or mobile phones.
It gives you a secure way to view reports, track KPIs, update data, and make decisions anytime and anywhere, help you respond to the quick changes in the business.
How to Design Mobile Reports?
Step 1: Adjust the Size of Reports
When designing a mobile template in a PC designer, there may be many problems in the setting of component layout and component size due to the difference in screen size.
Before designing reports, it is better to adjust the canvas size to fit the mobile phone size. In this way, the style of template content on the PC is closer to the mobile phone effect, which reduces unnecessary adjustment later.
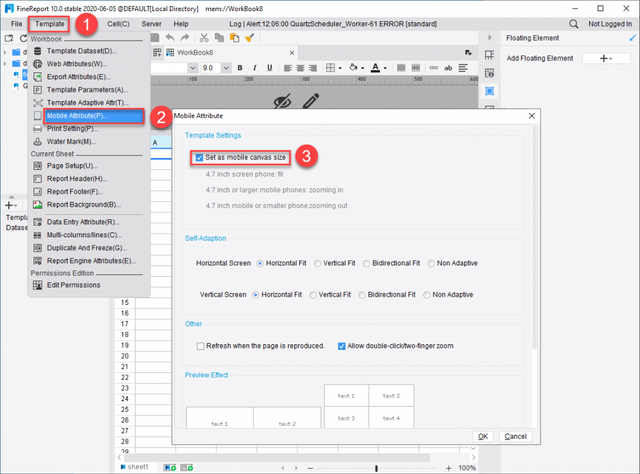
In the FineReport, select the mobile attribute and check [Set as mobile canvas size]; the designer will automatically adjust it to the size that is suitable for the 4.7-inch phone screen (375*560).

Step2: Design the layout
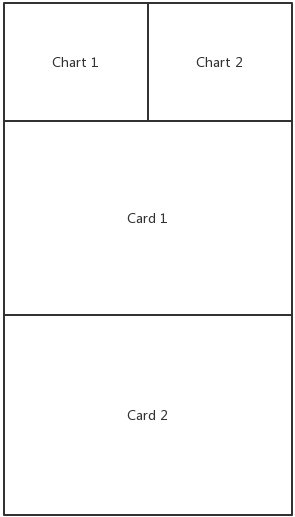
The flow layout design is the most popular app layout on the C-end, which is also applicable to the data presented on the B-end.
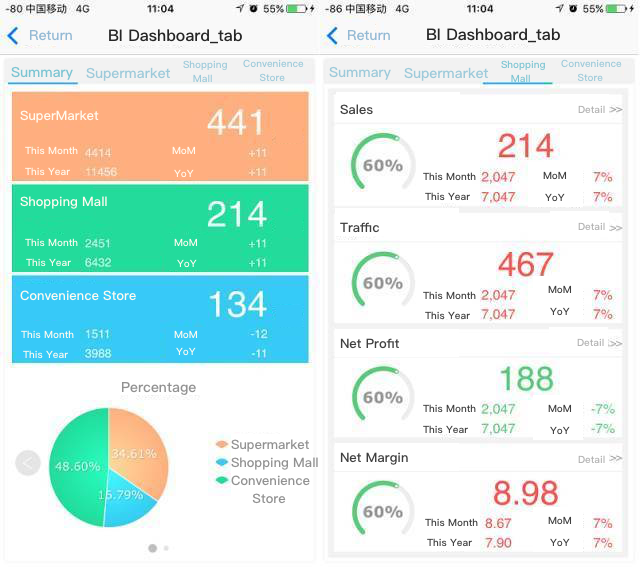
Place all key indicators in a tiled manner, which is simple to develop and provides a quick overview of the content. It is better to summarize the performance in the beginning so that the managers can catch the current progress and status of indicators at a glance, then fully express each indicator the managers care about to find problems or insights.

Step3: Rich the widgets
Due to the limited screen size, if the flow layout is used, the template would be longer and longer when it continues adding the content, which requires a lot of slide movement for reading. You can make the data more three-dimensional by adding interactive actions to the entire template or to a single component.
For example, you can use the tab to segment the data into several parts. The segmentation logic can be at the same or different levels.

Step 4: Modify the Details
How to improve your mobile templates while presenting the data? This can be a little bit difficult for developers. Here are some tips.
1. Banner
It is common to use the banner to improve the beauty of the mobile template.
Generally, the banner will be placed at the top. Here are some structures:
Report Title + Company’s logo
User Name + Company’s logo
Report Title + Main Index
2. Index card
Due to the limit of screen size, we should make good use of every inch of the mobile space. The index card can help you display the data in a reasonable structure.
3.Combination
We usually use widgets to visualize the data; similarly, we can also take advantage of the report blocks. In each block, you can combine colors, progress bars, and growth trends to make the data more prominent.
4.Color Matching
Don’t ignore the consistency of colors when selecting the colors.
In the color table, extracting the color according to some rules and apply to their own report or chart, can achieve color coordination of the visual effect. For example, you can select the colors of the same color system horizontally.
Step5: Preview the reports
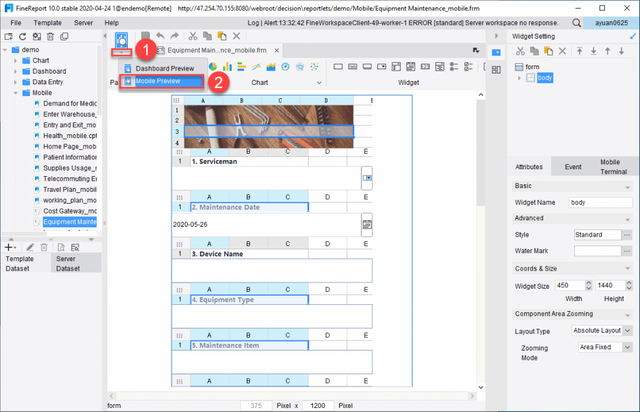
Finally, a mobile report template is completed. You can preview on the mobile terminal by scanning the QR code with your mobile phone. When the network is not good, you can open the offline mode and view the report offline. Besides, you can set a regular message push to notify the managers to check the reports on mobile.
- Click the arrow under the Preview button in the designer and select [Mobile Preview].

Mobile Reporting Tools
FineReport makes the templates used in the tutorials above. FineReport is a reporting software that provides a mobile reporting solution called FineMobile.
FineMobile’s function experience is as cool as that of the PC side. It mainly has four unique advantages for mobile devices.
1.Interactive
FineReport provides excellent interactive operations to deal with dynamic reports.
Drilling &linkage: The mobile-side supports data analysis functions such as drilling down and data linkage between charts.
Parameter query: On the mobile side, users can use the query button under the bottom-funnel button for data filter and display.
Pinch-Zoom Gesture: FineMobile supports pinch-zoom gesture. You can click zooming to view the details.
2.Rich features
Message Push: FineReport supports integrating with Line or other apps. You can set the timing frequency and trigger conditions to push messages to realize real-time data notification and warning.
Annotation Sharing: Users can make annotations and share them with colleagues by email or Line for further discussion on the mobile terminals.
Offline Viewing: When the network environment is not good, the offline mode will be enabled.
3.Data collection on the mobile side
Scanning & Inputting: You can scan QR code or barcode with a mobile phone camera to achieve data queries and data entry.
Mobile Data Entry: FineMobile supports various types of widgets for users to collect data anytime and anywhere, as well as supports data validation and submission for temporary storage.
Photo Uploading: You can upload, submit photos with mobile phone cameras.
4. Security Guarantee
To escort mobile data security, FineMobile inherits data permission settings from the PC side, binds MAC address to mobile devices, and supports VPN channel encryption.
Original Source: https://www.finereport.com/en/reporting-tools/mobile-reporting.html