Bitcoin price analysis
Bitcoin the mother of all crypto currency is showing some bullish and good indicators we will see some of the signs from the charting of the Bitcoin.
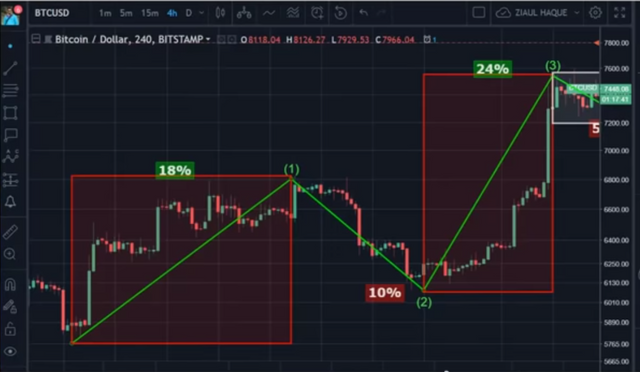
The above chart is from the month of July ,and we can clearly see than after the 18% gain then there is a correction of 10 % ,and after the correction there is again a steap upward slope which took the price up by 24% , again a correction of 5% took place
And a upward trend of 18% followed with something interesting
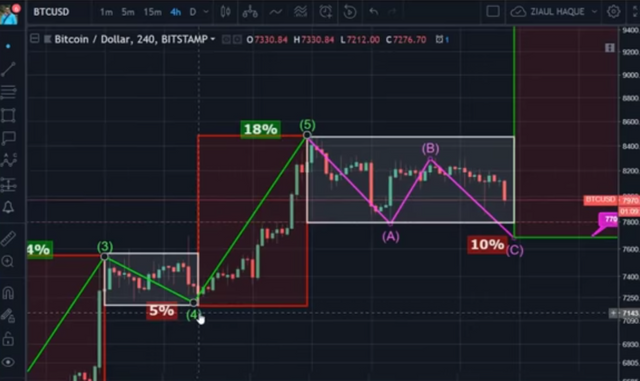
Nw the correction according to the calculations should be of 10% as drawn with the pink lines in the image 2 ,this 10% is the expected correct And this time already 7% correction is done that is the Bitcoin is down by 7% ,be it go down by 10% there will be implusive wave of 18-24 % which will hang Bitcoin somewhere between 9100-9500$.
I would like to explain the meaning of the green lines they are called as implusive waves and the pink lines a,b,and c are correction waves ,, implusive waves consist of 5 waves which I have drawn and given the numbers followed by a correction wave (in pink) and again the implusive wave is the law of the nature or u can say charting.
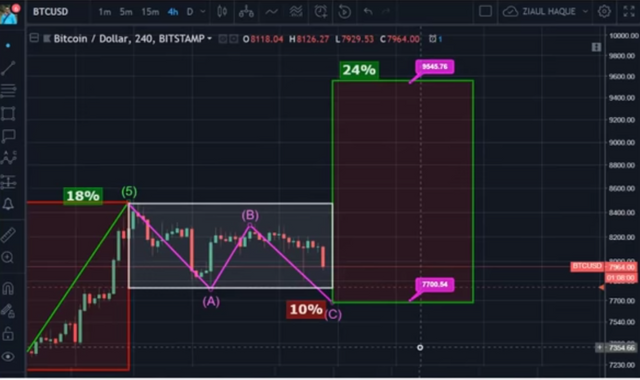
In the last (above ) image I clearly drawn the block for 24% upward rally of the Bitcoin in the coming days ,so buy the bitcoins in low this can be last chance as ETF date is also approaching (10 August).
Thanks
From ,
Limitlessphalak
ETF will really change the game so last chance to buy bitcoin on this price
ETF will make Bitcoin reach all times high may be beyond our imagination