Basic knowledge of Candlestick in Cryptocurruncy

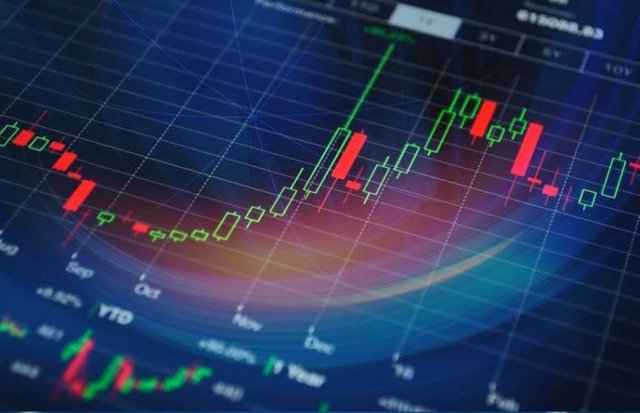
Candlesticks are a commonly used tool that helps day traders and now crypto traders determine future prices as well as market sentiment, in the hopes of making some profit from their trades.
Price activity during a specific period is often represented by the candlestick typically contains four components:
Open –price when trading begins on the asset
Close –price of asset at trade closure
High –highest price at which the asset was traded in between the open and close
Low –lowest price at which asset was traded during same interval
The asset(s) typically go through these phases, depending on a few key factors like demand, supply, news items, and other fundamentals. These components are highlighted on the candlestick, usually in the form of two distinct features.
The first and most obvious part is called the body. This is wide and bold, and contains information about the prices at which thee asset opened and closed during the specific timeframe.
Good candlestick charting looks at it from the bottom up. If the prices were low at the beginning and ended on a high, that indicates profit. If it’s prices are lower at the close than they were at the open, that’s loss or asset price depreciation.
The other two parts of the candlestick are known as the upper shadow and lower shadow. These are the thin lines extending from the body, up and down respectively, and indicate the prices at which the trade was opened and when it was closed.
Candlestick charting once fully understood, can be profitable for crypto traders. As long as they do their due diligence and understand that the crypto market is wildly volatile and unpredictable, they can consistently profit from the price fluctuations and make a killing in the process.
https://steemit.com/mgsc/@moinece36/women-s-you-won-t-believe-that-they-exists
Hope u will do the same
dont worry