Understanding the vibrant spectrum of neuropsychological conditions
I decided to elaborate on my earlier article about neurodivergence. In the context of neurodiversity, a spectrum often hints at autism, though, I would say that this is valid for any neuropsychological condition. And I strongly dislike the word “condition” since we are not ill but I cannot think of a good alternative. Feel free to suggest substitutes. Neurodiversity refers to conditions such as autism spectrum disorder, bipolar disorder, and ADHD. These differences should be embraced and celebrated as they make us all unique.

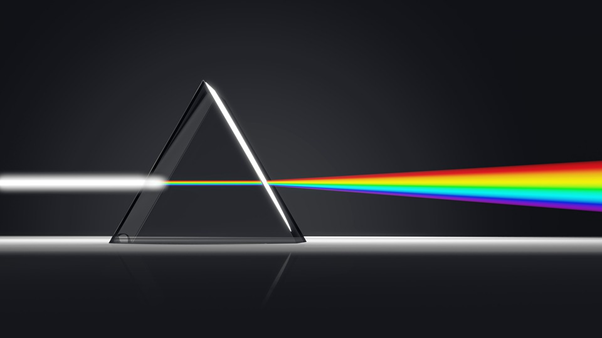
A prism splits light into its components with different wavelengths. The rainbow of colours is the light spectrum. (Picture: Pixabay)
A spectrum implies a variety of traits. This can include anything from colours to personality types. It has nothing to do with being better/worse but simply as a set of possible options. For example, there is a spectrum of personality types, from the highly introverted to the highly extroverted. At one end of the spectrum are people who need plenty of alone time to recharge their batteries, and at the other end are those who thrive on being around others and find energy in social situations. Most people fall somewhere in between these two extremes; they enjoy spending time alone but also enjoy being around others occasionally. There is no right or wrong way to be, as each person’s personality is unique. However, knowing where you lie on this spectrum can help you better understand yourself and how you interact with others.

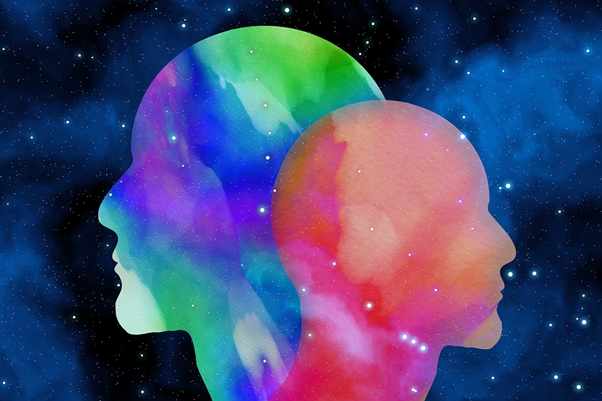
Each person has a unique set of traits that make them who they are. Imagine that we were all acting and thinking in the same manner! (Picture: Pixabay)
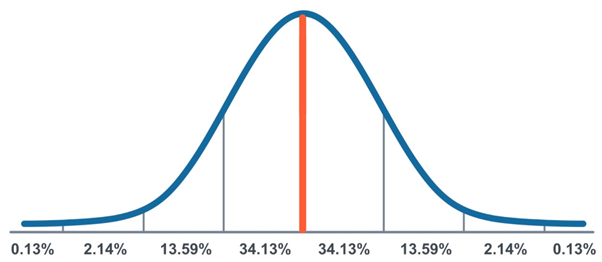
If you have studied some math or natural science course, you probably have seen bell curves, i.e., the “normal distribution”. While I do not intend to give a lecture on statistics, below is a plot that practically anybody can understand. The vertical axis shows the probability. The vertical line in the middle is the average value. There are many other values on each side of it. They deviate from the average. Some of them lie far out. Somewhere in that outlier region, one could put us, neurodivergent people in regard to our way of thinking. We are fewer than the average, which often puts us into an unfavourable position in society in the sense that differences are hated. Note that not every neurodivergent person has all possible traits associated with a condition. I will not delve into that since it deserves an article of its own. Or a series of them.

A bell curve — the colloquial name for the normal distribution, also known as Gaussian distribution. The average lies in the middle. Any value to the left or to the right deviates from the average. (Picture: Canva)
Think of the light spectrum. Is being blue better than being red? Is green some kind of an ideal standard that everything non-green has to strive for?

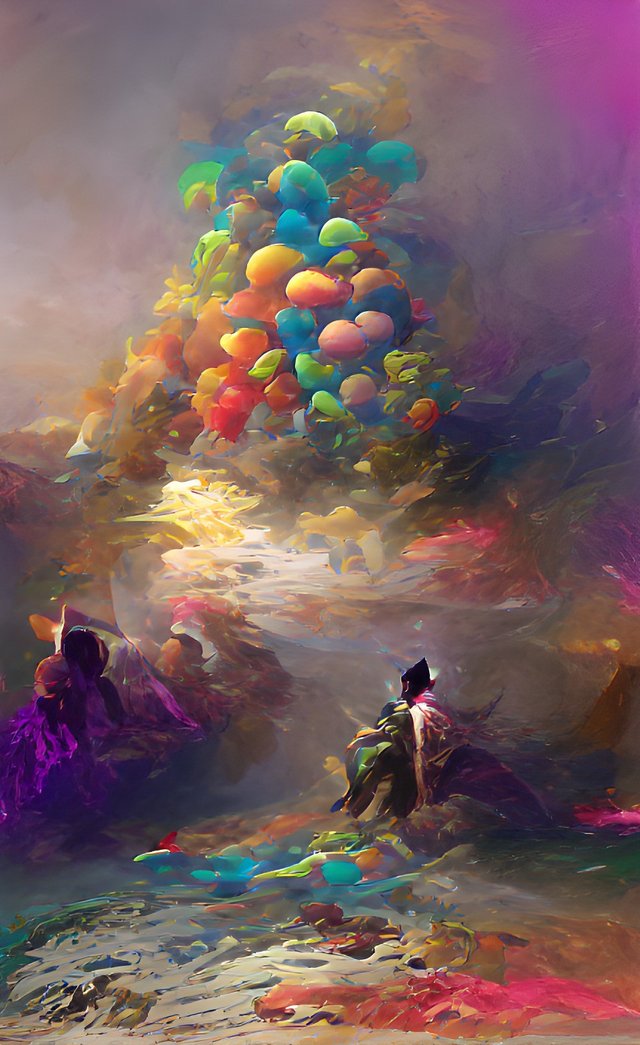
“Neurodiversity” — an artwork that I generated using the Wombo Dream app.

This article is reposted on my other blogging and social profiles.
https://linktr.ee/neurodivergent_ai
Check out more of my artworks in my community on Ko-Fi.