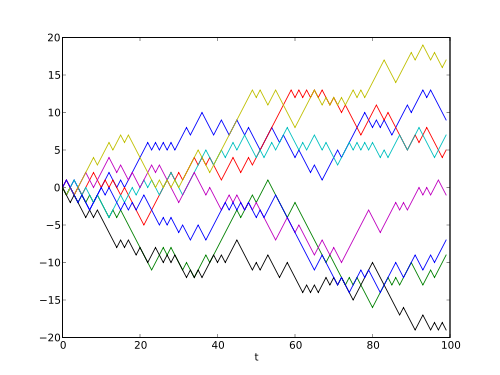
Could it be possible to profitably trade a random walk?

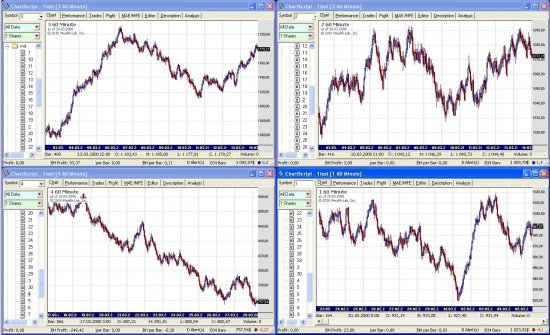
Is it actually possible to profitably trade a random walk? I found someone who claims to have proven it. In this blog post, the author randomly generates 30 different price series. Each consists of three million randomly generated price changes. Every 60 changes are consolidated into what the author represents as a total of 50,000 one minute OHLC price bars.

He states the method used to generate the price changes as follows: "Every subsequent quotation will be calculated as the previous quotation minus a random number ranging from -1 to +1." It is not clear from this description whether real numbers in the range were used, only the integers (-1, 0, +1), or only -1 and +1 were used. It will not matter in our analysis, as all of these cases can be simulated by a binomial option pricing model, with p=0.5 and the number of steps adjusted to match the volatility of whatever method was used. This will reduce the analysis to the unbiased discrete random walk considered below.
The author then devises a trading system based on a moving average crossover, and Bollinger band exits with a stop loss five times larger than the profit target. The system produced a profit on all 30 time series! What is going on here?

Has he proved it is possible to trade a random walk profitably? Of course not. Can we demonstrate this? It looks difficult, as the Bollinger band exit target and stop loss change as the trade progresses. We can prove a simpler case first. Consider an unbiased random walk which represents our profit or loss after betting on a series of coin flips. We want to calculate the probability of winning m bets before we lose n bets. In the following video, the professor shows how to calculate the biased case using roulette bets, and then shows the same calculation for the unbiased case:
At 43:24, the solution is shown: Pr(win $m before lose $n) = n/(n+m)
This is what we would expect intuitively. We win $100 before losing $500 exactly 5/6 of the time, and we lose the $500 exactly 1/6 of the time. This makes the expectation zero: (5/6)*100 - (1/6)*500 = 0. In fact, the expectation is zero regardless of the choice of m and n: [n/(n+m)]*m - [m/(n+m)]*n = [(n*m)/(n+m)] - [(m*n)/(n+m)] = 0.
With the Bollinger band system, at any given point in an open trade, the position of the stop loss and profit target depend on the prior price history. In the author's example, it depends on the last 100 bars. To prove formally that his system has zero expectancy, we can sum up over all possible price histories the product of the probability of that particular price history happening and the expectancy given from the resulting stop loss and profit target. But we can see from the symmetry of the problem that these will sum up to zero. We are equally likely to be one step closer to the target as we are to be one step away from it, since n/(n+m) and m/(n+m) are both 1/2 when n and m are equal. This will make all the expectancies resulting from the price having moved relative to the moving Bollinger band profit targets and stop losses cancel out.
Almost by definition, there is no trading system that can produce profits from a randomly generated price series. What he has done is akin to looking for a small error in the Pythagorean theorem by drawing 30 right triangles and measuring them with a ruler. All he has done is proven that either his random number generator is very slightly biased, or that his trading system code has a look-ahead bias.
Image Credits:
https://en.wikipedia.org/wiki/Random_walk
http://investazy.com/blog/280.php
Credit to Walter Block for the Pythagorean theorem analogy, used in a different context.
The key for why he gets this result is in the original article:
Essentially he's saying that when his random price gets through a 2 SD entropy barrier he wins, when the price gets through a 4 SD entropy barrier he loses, otherwise he lets it ride. If the entropy barrier for accepting a loss is 2 SD higher than for accepting a win, it's entirely reasonable that N = 30 is too small a sample to see any losses.
This is similar to the martingale system -- if you set the criterion for quitting to be either a small win or a large loss, then it's entirely possible to see a long run of wins for zero or negative EV, because the balance to those modest positive outcomes of very high probability gets concentrated into a single disastrous outcome of very low probability.
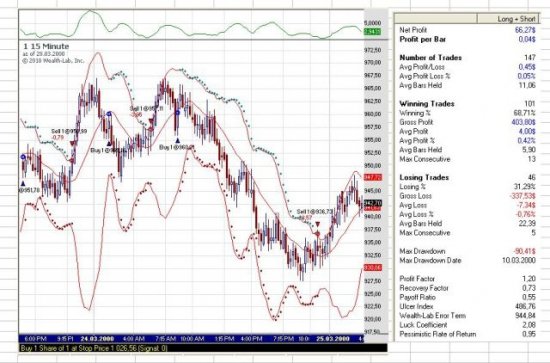
It's even worse than this. For the system that profited on all 30 series, he used a 1SD profit target and a 5SD stop loss. And he did make thousands of trades, with many losses. It's hard to read this blurry image, but it looks like he optimized on those two parameters:
With #OptVar1 50 and #OptVar2 10 corresponding to the 5SD stop and 1SD target. So it could be an issue of curve fitting, where he just kept optimizing until he found a set of parameters that worked.
Just writing my master's thesis about trading algorithms. I'm not even pretending to beat the market, let alone a random walk :D
Nice, I don't think master's programs like that existed when I went to school. I went with electrical engineering, but it's pretty much all math in some form or another.
No, it's not a special program. I'm also doing electrical engineering - there is just a chair devoted to reinforcement learning.
I am using quantitative analysis models for 8+ years and I say it's possible but the answer is more complicated.
First of all the word random is not well used. Random means it's unpredictable.
A market, or a time series is very predictable, forecastable and confine-able between different probability boundaries.
This alone won't be profitable long term, because it's still random, yet it's crucial information to model the risk, give us an expectation of profit, and and expectation of volatility.
I use all kind of statistical models to forecast markets, you can check out my articles, I write frequently about it. But this alone is not enough to be profitable, it is still random, and in long term we would have 0 Expected Value of profits.
To make it profitable, we need to gather external information, like fundamental analysis to time market movements well, the price chart alone is not enough for that.
But anyway good article, but the options models like Black-Scholes, only work on derivatives where there are 2 markets to extract info from. I prefer currency markets, cryptocurrency lately.
Congratulations @sicilian! You have received a personal award!
Click on the badge to view your own Board of Honor on SteemitBoard.
For more information about this award, click here
Congratulations @sicilian! You received a personal award!
You can view your badges on your Steem Board and compare to others on the Steem Ranking
Vote for @Steemitboard as a witness to get one more award and increased upvotes!