TRADING S&P 07/21/2017 Daily insight, S&P futures, ES
This is my daily preparation for S&P futures (ES) trading and it is for your educational purpose only and definitely cannot be considered as financial advice. There is a substantial risk in derivative trading and it might not be suitable for you. Don't rely on past performance as it is not indicative of future results.
We started a week with very balanced day and narrow range around last Friday's highs. However, on Tuesday, bullish players used fake breakout downwards from Monday's range to open their long positions after what market remained in an uptrend. gradual rise towards new highs.
We also can see that there is great interest in ES among trades, as new contracts continued to build up on Tuesday, Wednesday and yesterday. Open interest grew by 20K, 24K and 26K respectively.
Considering that we had a ranging day yesterday and we are about to open inside yesterday's range I will be considering possibilities both way, buying and selling.
In order to buy I'm looking for yesterdays' range to hold and enough buyers to be between 2468.5-2474.25 prices, for low of yesterday's range to hold. Any break above 2474.25 is expected to lead towards new all time highs and an upwards trend for the most of the day up to 2482.5 area.
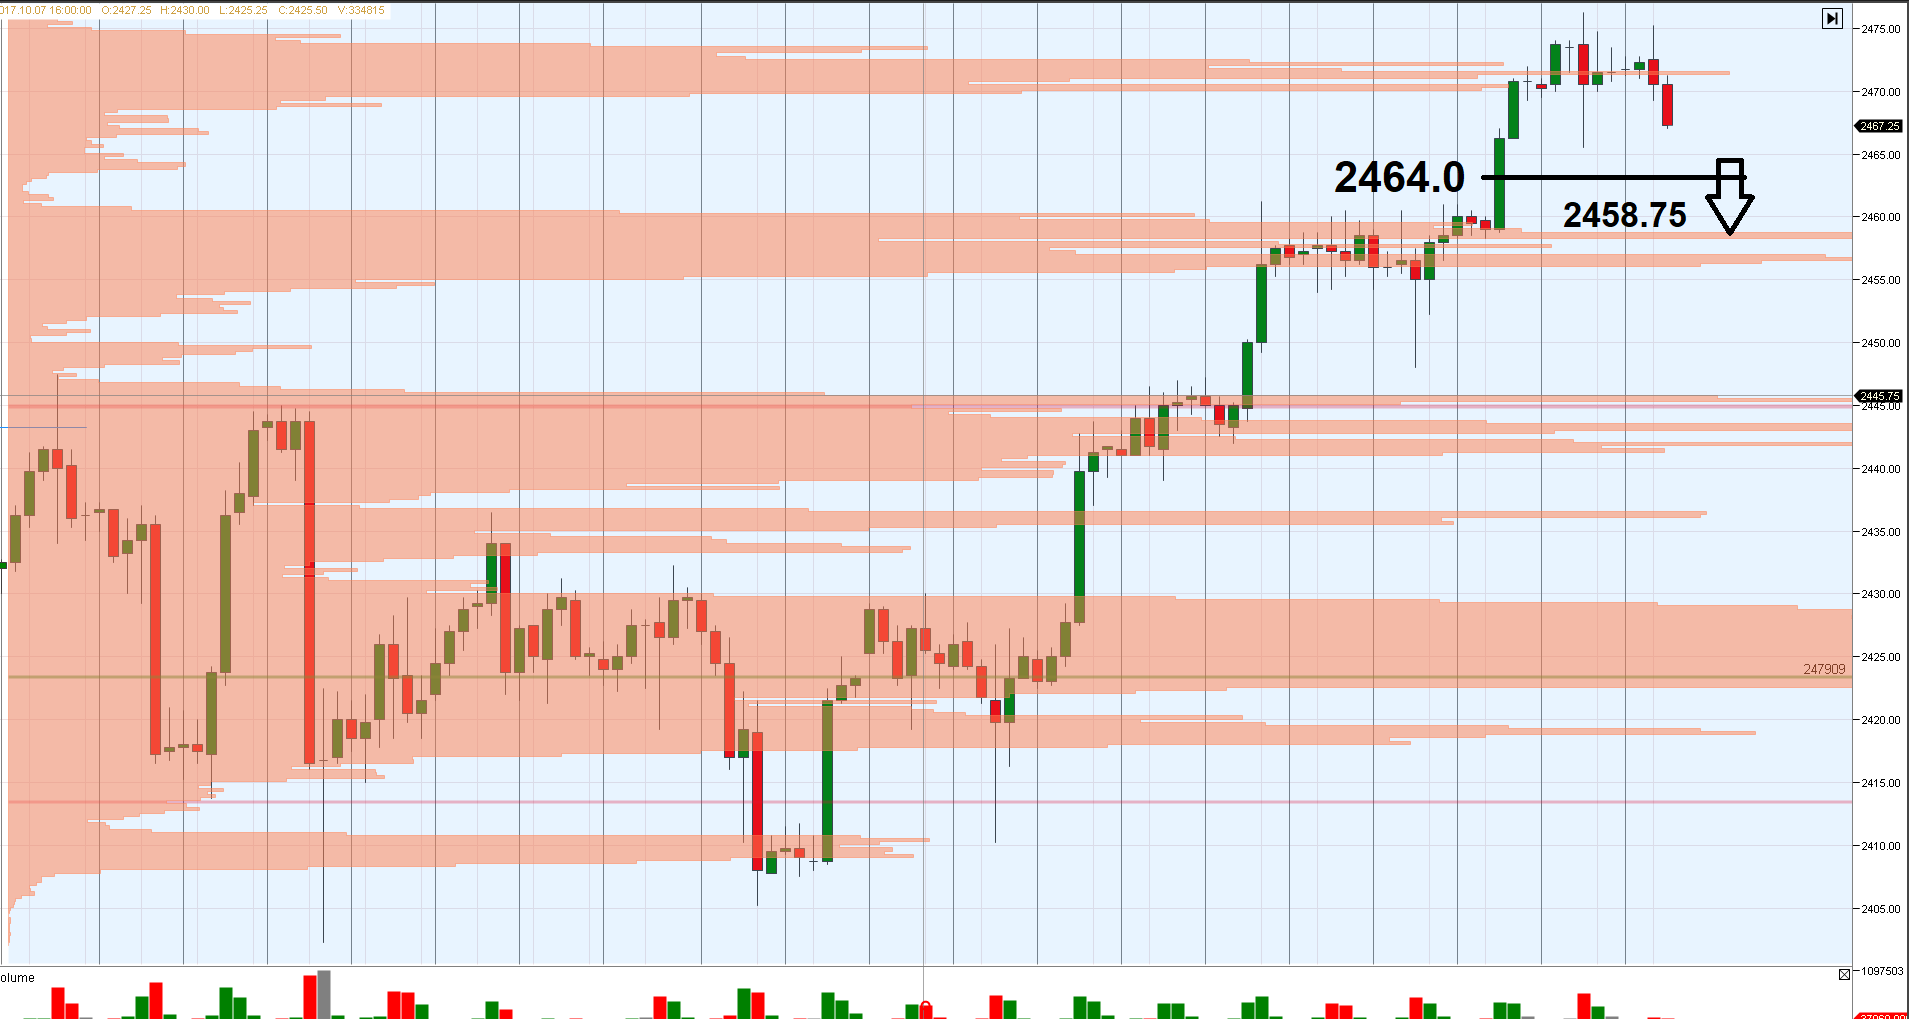
In case we will break 2468.5 and enough volumes will be build just below this level I expect a following target will be 2464. And if day will evolve in a downwards trend channel there is also a potential for the 2460-2458.75 by the end of the day.
However, considering the fact that it is Friday and summer time, the a development of a ranging day between 2468.5-2474.25 is very possible. In this case, I might enter some trades with very low risk, but only in the afternoon.
you use volume to show resitance/ support and range?
hey, sorry, holidays went out of control, but finally getting back to work :) to a large extent yes, volumes play a core role in my analysis and helps me to identify ranges and zones of potential resistance/levels. Of course everything is in a context of longer and shorter term periods, weak/ strong lows and highs etc. Similar to value profile analysis, but adapted to volumes. During the day I'm also following DOM to see how price behaves in high/low volume areas to indicate general mood of the market.